- Mahotas - Home
- Mahotas - Introduction
- Mahotas - Computer Vision
- Mahotas - History
- Mahotas - Features
- Mahotas - Installation
- Mahotas Handling Images
- Mahotas - Handling Images
- Mahotas - Loading an Image
- Mahotas - Loading Image as Grey
- Mahotas - Displaying an Image
- Mahotas - Displaying Shape of an Image
- Mahotas - Saving an Image
- Mahotas - Centre of Mass of an Image
- Mahotas - Convolution of Image
- Mahotas - Creating RGB Image
- Mahotas - Euler Number of an Image
- Mahotas - Fraction of Zeros in an Image
- Mahotas - Getting Image Moments
- Mahotas - Local Maxima in an Image
- Mahotas - Image Ellipse Axes
- Mahotas - Image Stretch RGB
- Mahotas Color-Space Conversion
- Mahotas - Color-Space Conversion
- Mahotas - RGB to Gray Conversion
- Mahotas - RGB to LAB Conversion
- Mahotas - RGB to Sepia
- Mahotas - RGB to XYZ Conversion
- Mahotas - XYZ to LAB Conversion
- Mahotas - XYZ to RGB Conversion
- Mahotas - Increase Gamma Correction
- Mahotas - Stretching Gamma Correction
- Mahotas Labeled Image Functions
- Mahotas - Labeled Image Functions
- Mahotas - Labeling Images
- Mahotas - Filtering Regions
- Mahotas - Border Pixels
- Mahotas - Morphological Operations
- Mahotas - Morphological Operators
- Mahotas - Finding Image Mean
- Mahotas - Cropping an Image
- Mahotas - Eccentricity of an Image
- Mahotas - Overlaying Image
- Mahotas - Roundness of Image
- Mahotas - Resizing an Image
- Mahotas - Histogram of Image
- Mahotas - Dilating an Image
- Mahotas - Eroding Image
- Mahotas - Watershed
- Mahotas - Opening Process on Image
- Mahotas - Closing Process on Image
- Mahotas - Closing Holes in an Image
- Mahotas - Conditional Dilating Image
- Mahotas - Conditional Eroding Image
- Mahotas - Conditional Watershed of Image
- Mahotas - Local Minima in Image
- Mahotas - Regional Maxima of Image
- Mahotas - Regional Minima of Image
- Mahotas - Advanced Concepts
- Mahotas - Image Thresholding
- Mahotas - Setting Threshold
- Mahotas - Soft Threshold
- Mahotas - Bernsen Local Thresholding
- Mahotas - Wavelet Transforms
- Making Image Wavelet Center
- Mahotas - Distance Transform
- Mahotas - Polygon Utilities
- Mahotas - Local Binary Patterns
- Threshold Adjacency Statistics
- Mahotas - Haralic Features
- Weight of Labeled Region
- Mahotas - Zernike Features
- Mahotas - Zernike Moments
- Mahotas - Rank Filter
- Mahotas - 2D Laplacian Filter
- Mahotas - Majority Filter
- Mahotas - Mean Filter
- Mahotas - Median Filter
- Mahotas - Otsu's Method
- Mahotas - Gaussian Filtering
- Mahotas - Hit & Miss Transform
- Mahotas - Labeled Max Array
- Mahotas - Mean Value of Image
- Mahotas - SURF Dense Points
- Mahotas - SURF Integral
- Mahotas - Haar Transform
- Highlighting Image Maxima
- Computing Linear Binary Patterns
- Getting Border of Labels
- Reversing Haar Transform
- Riddler-Calvard Method
- Sizes of Labelled Region
- Mahotas - Template Matching
- Speeded-Up Robust Features
- Removing Bordered Labelled
- Mahotas - Daubechies Wavelet
- Mahotas - Sobel Edge Detection
Mahotas - XYZ to RGB Conversion
We learnt about XYZ color space, RGB color space, and RGB to XYZ conversion in our previous tutorial. Now let us discuss about the conversion of XYZ color space to RGB color space.
When we convert from XYZ to RGB, we are taking the XYZ values of a color, which represent its perceptual properties, and transforming them into red, green, and blue values.
This conversion allows us to represent the color in a format that is suitable for display on a particular device or screen.
XYZ to RGB Conversion in Mahotas
In Mahotas, we can convert an XYZ image to an RGB image using the colors.xyz2rgb() function.
The XYZ to RGB conversion in Mahotas involves the following steps −
Normalize the XYZ values − Normalize the X, Y, and Z values so that they range between 0 and 1. This step ensures that the XYZ values are relative to a reference white point and allows for consistent color calculations.
Convert normalized XYZ to linear RGB − Next, use a conversion matrix to convert the normalized XYZ values to linear RGB values. The conversion matrix specifies how the XYZ coordinates contribute to the red, green, and blue components of the resulting color.
The matrix multiplication is performed to obtain the linear RGB values.
Apply gamma correction − Gamma correction adjusts the brightness of the RGB values to match the response of the human visual system.
Scale the RGB values − After gamma correction, the RGB values are typically in the range of 0 to 1. To represent the colors in the 8−bit range (0−255), you need to scale the RGB values.
Multiply each of the gamma−corrected RGB values by 255 to bring them to the appropriate scale.
Result − Once the scaling is applied, you have obtained the RGB color values. These values represent the intensities of the red, green, and blue channels of the resulting color.
Using the mahotas.colors.xyz2rgb() Function
The mahotas.colors.xyz2rgb() function takes an XYZ image as input and returns the RGB color space version of the image.
The resulting RGB image retains the structure and content of the original XYZ image, however some color detail is lost.
Syntax
Following is the basic syntax of the xyz2rgb() function in mahotas −
mahotas.colors.xyz2rgb(xyz, dtype={float})
where,
xyz − It is the input image in XYZ color space.
dtype (optional) − It is the data type of the returned image (default is float).
Example
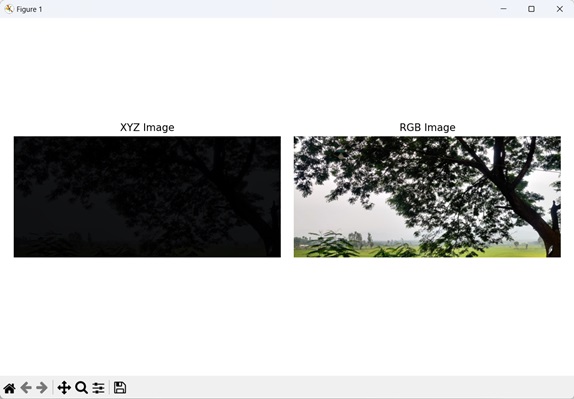
In the following example, we are converting an XYZ image to an RGB image using the mh.colors.xyz2rgb() function −
import mahotas as mh
import numpy as np
import matplotlib.pyplot as mtplt
# Loading the image
image = mh.imread('nature.jpeg')
# Converting it to XYZ
xyz_image = mh.colors.rgb2xyz(image)
# Converting back to RGB (lossy)
rgb_image = mh.colors.xyz2rgb(xyz_image)
# Creating a figure and axes for subplots
fig, axes = mtplt.subplots(1, 2)
# Displaying the original XYZ image
axes[0].imshow(xyz_image)
axes[0].set_title('XYZ Image')
axes[0].set_axis_off()
# Displaying the RGB image
axes[1].imshow(rgb_image)
axes[1].set_title('RGB Image')
axes[1].set_axis_off()
# Adjusting spacing between subplots
mtplt.tight_layout()
# Showing the figures
mtplt.show()
Output
Following is the output of the above code −
Using Transformation Matrix
We can use a transformation matrix to convert an XYZ image to an RGB image. The transformation matrix has a set of values that are used to transform a XYZ pixel to RGB pixel.
- The XYZ pixels are converted to RGB pixels by doing matrix multiplication between the transformation matrix and the XYZ image.
- We achieve this by using the dot() function in the numpy library.
- The values of each pixel are then normalized from the range of 0 to 1 (intensity range of XYZ color) to the range of 0 to 255 (intensity range of RGB colors) by multiplying by 255 and then dividing by the maximum intensity of that pixel to obtain the RGB image.
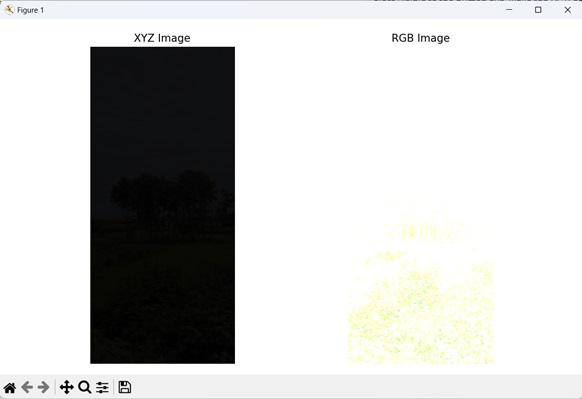
Example
The following example shows conversion of an XYZ image to an RGB image using transformation matrix −
import mahotas as mh
import numpy as np
import matplotlib.pyplot as mtplt
# Function to convert XYZ to RGB
def xyz_to_rgb(xyz_image):
   # XYZ to RGB conversion matrix
   xyz_to_rgb_matrix = np.array([[3.2406, -1.5372, -0.4986],
   [-0.9689, 1.8758, 0.0415],[0.0557, -0.2040, 1.0570]])
   # Perform the XYZ to RGB conversion using matrix multiplication
   rgb_image = np.dot(xyz_image, xyz_to_rgb_matrix.T)
   # Scale the RGB values from the range [0, 1] to [0, 255]
   rgb_image = (rgb_image * 255.0 / np.max(rgb_image)).astype(np.uint8)
   return rgb_image
# Loading the image
image = mh.imread('tree.tiff')
# Converting it to XYZ
xyz_image = mh.colors.rgb2xyz(image)
# Converting back to RGB (lossy)
rgb_image = xyz_to_rgb(xyz_image)
# Creating a figure and axes for subplots
fig, axes = mtplt.subplots(1, 2)
# Displaying the original XYZ image
axes[0].imshow(xyz_image)
axes[0].set_title('XYZ Image')
axes[0].set_axis_off()
# Displaying the RGB image
axes[1].imshow(rgb_image)
axes[1].set_title('RGB Image')
axes[1].set_axis_off()
# Adjusting spacing between subplots
mtplt.tight_layout()
# Showing the figures
mtplt.show()
Output
Output of the above code is as follows −