- Mahotas - Home
- Mahotas - Introduction
- Mahotas - Computer Vision
- Mahotas - History
- Mahotas - Features
- Mahotas - Installation
- Mahotas Handling Images
- Mahotas - Handling Images
- Mahotas - Loading an Image
- Mahotas - Loading Image as Grey
- Mahotas - Displaying an Image
- Mahotas - Displaying Shape of an Image
- Mahotas - Saving an Image
- Mahotas - Centre of Mass of an Image
- Mahotas - Convolution of Image
- Mahotas - Creating RGB Image
- Mahotas - Euler Number of an Image
- Mahotas - Fraction of Zeros in an Image
- Mahotas - Getting Image Moments
- Mahotas - Local Maxima in an Image
- Mahotas - Image Ellipse Axes
- Mahotas - Image Stretch RGB
- Mahotas Color-Space Conversion
- Mahotas - Color-Space Conversion
- Mahotas - RGB to Gray Conversion
- Mahotas - RGB to LAB Conversion
- Mahotas - RGB to Sepia
- Mahotas - RGB to XYZ Conversion
- Mahotas - XYZ to LAB Conversion
- Mahotas - XYZ to RGB Conversion
- Mahotas - Increase Gamma Correction
- Mahotas - Stretching Gamma Correction
- Mahotas Labeled Image Functions
- Mahotas - Labeled Image Functions
- Mahotas - Labeling Images
- Mahotas - Filtering Regions
- Mahotas - Border Pixels
- Mahotas - Morphological Operations
- Mahotas - Morphological Operators
- Mahotas - Finding Image Mean
- Mahotas - Cropping an Image
- Mahotas - Eccentricity of an Image
- Mahotas - Overlaying Image
- Mahotas - Roundness of Image
- Mahotas - Resizing an Image
- Mahotas - Histogram of Image
- Mahotas - Dilating an Image
- Mahotas - Eroding Image
- Mahotas - Watershed
- Mahotas - Opening Process on Image
- Mahotas - Closing Process on Image
- Mahotas - Closing Holes in an Image
- Mahotas - Conditional Dilating Image
- Mahotas - Conditional Eroding Image
- Mahotas - Conditional Watershed of Image
- Mahotas - Local Minima in Image
- Mahotas - Regional Maxima of Image
- Mahotas - Regional Minima of Image
- Mahotas - Advanced Concepts
- Mahotas - Image Thresholding
- Mahotas - Setting Threshold
- Mahotas - Soft Threshold
- Mahotas - Bernsen Local Thresholding
- Mahotas - Wavelet Transforms
- Making Image Wavelet Center
- Mahotas - Distance Transform
- Mahotas - Polygon Utilities
- Mahotas - Local Binary Patterns
- Threshold Adjacency Statistics
- Mahotas - Haralic Features
- Weight of Labeled Region
- Mahotas - Zernike Features
- Mahotas - Zernike Moments
- Mahotas - Rank Filter
- Mahotas - 2D Laplacian Filter
- Mahotas - Majority Filter
- Mahotas - Mean Filter
- Mahotas - Median Filter
- Mahotas - Otsu's Method
- Mahotas - Gaussian Filtering
- Mahotas - Hit & Miss Transform
- Mahotas - Labeled Max Array
- Mahotas - Mean Value of Image
- Mahotas - SURF Dense Points
- Mahotas - SURF Integral
- Mahotas - Haar Transform
- Highlighting Image Maxima
- Computing Linear Binary Patterns
- Getting Border of Labels
- Reversing Haar Transform
- Riddler-Calvard Method
- Sizes of Labelled Region
- Mahotas - Template Matching
- Speeded-Up Robust Features
- Removing Bordered Labelled
- Mahotas - Daubechies Wavelet
- Mahotas - Sobel Edge Detection
Mahotas - Loading an Image
To perform any operation on an image, we first need to load it into memory. Once the image is loaded, we can access its pixels and apply various operations on it.
Loading an image refers to reading an image file from a storage device (such as hard drive, USB drive, or network location) into memory.
Loading an Image in Mahotas
To load an image using Mahotas, we can use the imread() function, which reads an image file and returns it as a NumPy array.
A NumPy array is a grid of values, all of the same type, and indexed by a tuple of nonnegative integers. In the case of an image, the array represents the pixel values of the image.
Using the imread() Function
The imread() function is the core method in Mahotas for reading and loading images. It accepts a file path as input and returns a NumPy array representing the loaded image. This function can read various image file formats, such as JPEG, PNG, BMP, TIFF, etc.
Following is the basic syntax of imread() function in Mahotas −
mahotas.imread('image.file_format')
Where, 'image.file_format' is the actual path and format of the image you want to load.
Example
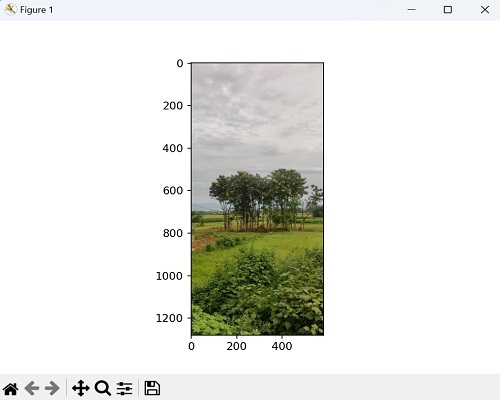
In the following example, we are using the imread() function to load an image file named "nature.jpeg" from the current directory. The resulting image is stored in the 'image' variable as a NumPy array −
import mahotas as mh
from pylab import imshow, show
# Loading the image using Mahotas
image = mh.imread('nature.jpeg')
# displaying the original image
imshow(image)
show()
Output
Output of the above code is as follows −
Loading Different Image Formats
The image format refers to the different file formats used to store and encode images digitally. Each format has its own specifications, characteristics, and compression methods.
Mahotas provides a wide range of image formats, including common formats like JPEG, PNG, BMP, TIFF, and GIF. We can pass the file path of an image in any of these formats to the imread() function.
Example
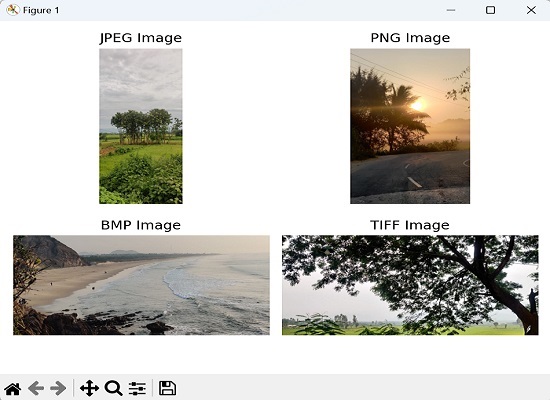
In this example, we demonstrate the versatility of Mahotas by loading images in different formats using the imread() function. Each loaded image is stored in a separate variable −
import mahotas as ms
import matplotlib.pyplot as mtplt
# Loading JPEG image
image_jpeg = ms.imread('nature.jpeg')
# Loading PNG image
image_png = ms.imread('sun.png')
# Loading BMP image
image_bmp = ms.imread('sea.bmp')
# Loading TIFF image
image_tiff = ms.imread('tree.tiff')
# Creating a figure and subplots
fig, axes = mtplt.subplots(2, 2)
# Displaying JPEG image
axes[0, 0].imshow(image_jpeg)
axes[0, 0].axis('off')
axes[0, 0].set_title('JPEG Image')
# Displaying PNG image
axes[0, 1].imshow(image_png)
axes[0, 1].axis('off')
axes[0, 1].set_title('PNG Image')
# Displaying BMP image
axes[1, 0].imshow(image_bmp)
axes[1, 0].axis('off')
axes[1, 0].set_title('BMP Image')
# Displaying TIFF image
axes[1, 1].imshow(image_tiff)
axes[1, 1].axis('off')
axes[1, 1].set_title('TIFF Image')
# Adjusting the spacing and layout
mtplt.tight_layout()
# Showing the figure
mtplt.show()
Output
The image displayed is as follows −
Loading Color Images
The color images are the ones we typically see, containing various colors. They are composed of three color channels− red, green, and blue. Each pixel's color is determined by the combination of these three channels. Color images can represent a wide range of colors and are similar to what we see with our eyes.
Loading color images in Mahotas means reading an image file that contains color information. The resulting image is represented as a 3D array, where each element represents the color values for each pixel in the red, green, and blue channels.
Following is the basic syntax for loading grayscale Images in Mahotas −
mahotas.imread('image.file_format')
Where, 'image.file_format' is the actual path and format of the image you want to load.
Example
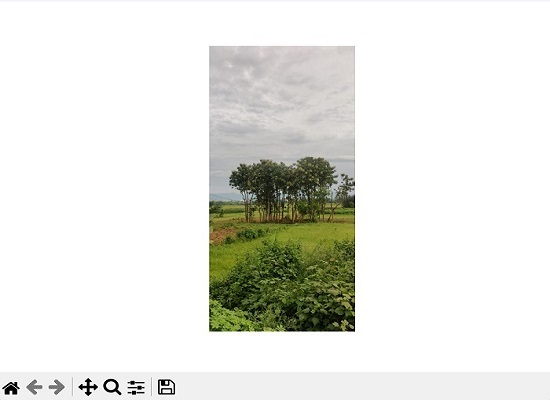
Following is an example of loading a color image in Mahotas −
import mahotas as ms
import matplotlib.pyplot as mtplt
# Loading colored image
colored_image = ms.imread('nature.jpeg')
# Displaying colored image
mtplt.imshow(colored_image)
mtplt.axis('off')
mtplt.show()
Output
Output of the above code is as follows −
Loading Color and Grayscale image
To load a grayscale image in mahotas, we need to pass the 'as_grey=True' parameter to the imread() function.
Example
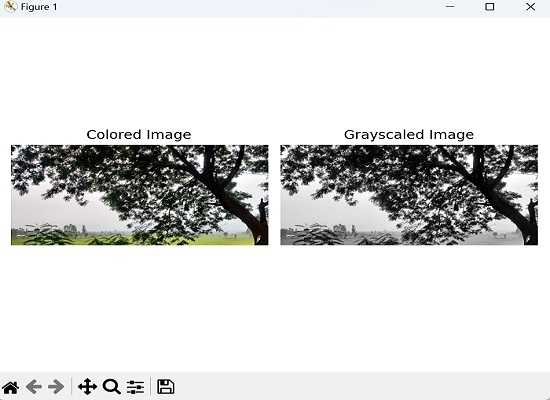
In the following example, we are trying to load a grayscale image and a color image together using Mahotas −
import mahotas as ms
import matplotlib.pyplot as mtplt
# Loading color image
color_image = ms.imread('tree.tiff')
# Loading grayscale image
grayscale_image = ms.imread('tree.tiff', as_grey=True)
# Creating a figure and subplots
fig, axes = mtplt.subplots(1, 2)
# Displaying colored image
axes[0].imshow(color_image)
axes[0].axis('off')
axes[0].set_title('Colored Image')
# Displaying grayscale image
axes[1].imshow(grayscale_image, cmap='gray')
axes[1].axis('off')
axes[1].set_title('Grayscaled Image')
# Adjusting the spacing and layout
mtplt.tight_layout()
# Showing the figure
mtplt.show()
Output
The output is as shown below −