- Mahotas - Home
- Mahotas - Introduction
- Mahotas - Computer Vision
- Mahotas - History
- Mahotas - Features
- Mahotas - Installation
- Mahotas Handling Images
- Mahotas - Handling Images
- Mahotas - Loading an Image
- Mahotas - Loading Image as Grey
- Mahotas - Displaying an Image
- Mahotas - Displaying Shape of an Image
- Mahotas - Saving an Image
- Mahotas - Centre of Mass of an Image
- Mahotas - Convolution of Image
- Mahotas - Creating RGB Image
- Mahotas - Euler Number of an Image
- Mahotas - Fraction of Zeros in an Image
- Mahotas - Getting Image Moments
- Mahotas - Local Maxima in an Image
- Mahotas - Image Ellipse Axes
- Mahotas - Image Stretch RGB
- Mahotas Color-Space Conversion
- Mahotas - Color-Space Conversion
- Mahotas - RGB to Gray Conversion
- Mahotas - RGB to LAB Conversion
- Mahotas - RGB to Sepia
- Mahotas - RGB to XYZ Conversion
- Mahotas - XYZ to LAB Conversion
- Mahotas - XYZ to RGB Conversion
- Mahotas - Increase Gamma Correction
- Mahotas - Stretching Gamma Correction
- Mahotas Labeled Image Functions
- Mahotas - Labeled Image Functions
- Mahotas - Labeling Images
- Mahotas - Filtering Regions
- Mahotas - Border Pixels
- Mahotas - Morphological Operations
- Mahotas - Morphological Operators
- Mahotas - Finding Image Mean
- Mahotas - Cropping an Image
- Mahotas - Eccentricity of an Image
- Mahotas - Overlaying Image
- Mahotas - Roundness of Image
- Mahotas - Resizing an Image
- Mahotas - Histogram of Image
- Mahotas - Dilating an Image
- Mahotas - Eroding Image
- Mahotas - Watershed
- Mahotas - Opening Process on Image
- Mahotas - Closing Process on Image
- Mahotas - Closing Holes in an Image
- Mahotas - Conditional Dilating Image
- Mahotas - Conditional Eroding Image
- Mahotas - Conditional Watershed of Image
- Mahotas - Local Minima in Image
- Mahotas - Regional Maxima of Image
- Mahotas - Regional Minima of Image
- Mahotas - Advanced Concepts
- Mahotas - Image Thresholding
- Mahotas - Setting Threshold
- Mahotas - Soft Threshold
- Mahotas - Bernsen Local Thresholding
- Mahotas - Wavelet Transforms
- Making Image Wavelet Center
- Mahotas - Distance Transform
- Mahotas - Polygon Utilities
- Mahotas - Local Binary Patterns
- Threshold Adjacency Statistics
- Mahotas - Haralic Features
- Weight of Labeled Region
- Mahotas - Zernike Features
- Mahotas - Zernike Moments
- Mahotas - Rank Filter
- Mahotas - 2D Laplacian Filter
- Mahotas - Majority Filter
- Mahotas - Mean Filter
- Mahotas - Median Filter
- Mahotas - Otsu's Method
- Mahotas - Gaussian Filtering
- Mahotas - Hit & Miss Transform
- Mahotas - Labeled Max Array
- Mahotas - Mean Value of Image
- Mahotas - SURF Dense Points
- Mahotas - SURF Integral
- Mahotas - Haar Transform
- Highlighting Image Maxima
- Computing Linear Binary Patterns
- Getting Border of Labels
- Reversing Haar Transform
- Riddler-Calvard Method
- Sizes of Labelled Region
- Mahotas - Template Matching
- Speeded-Up Robust Features
- Removing Bordered Labelled
- Mahotas - Daubechies Wavelet
- Mahotas - Sobel Edge Detection
Mahotas - Conditional Eroding Image
In our previous chapter, we explored the concept of image erosion, an operation used to shrink all the pixels to the boundaries of regions in an image. Conditional erosion on the other hand, shrinks (remove) the pixels of certain specific regions, based on some conditions.
The condition can be based on the intensity values of the image pixels or some specific pattern in the image.
For example, let's consider a grayscale image. Instead of eroding all the foreground pixels, you could conditionally erode only those pixels that meet a certain intensity threshold.
If a pixel's intensity is below a predefined threshold, then erosion is applied; otherwise, the pixel remains unchanged.
Conditional Eroding Image in Mahotas
In mahotas, conditional erosion is an extension of the traditional erosion operation that comprises a condition based on a second image, often referred to as the "marker image."
It allows you to control the erosion process such that erosion only occurs at locations where the marker image has specific pixel values.
We can perform the conditional erosion on an image in mahotas using the cerode() function. This function restricts the erosion process to specific regions based on the marker image's pixel values.
The mahotas.cerode() function
The cerode() function in Mahotas takes two inputs− the input image and a mask (condition) array. It performs conditional erosion on the input image based on the provided condition, and it returns the resulting eroded image.
Masks are used to identify specific regions within an image. They act as a filter that highlights certain areas while disregarding others.
Syntax
Following is the basic syntax of the cerode() function in mahotas −
mahotas.cerode(f, g, Bc={3x3 cross}, out={np.empty_as(A)})
Where,
f − It is the input image on which the conditional erosion is to be performed.
g − It is the mask to be applied during conditional erosion.
Bc={3×3 cross} (optional) − It is a structuring element used for dilation. Default is {3×3 cross}.
out={np.empty_as(A)} (optional) − It provides an output array to store the result of the erosion operation
Example
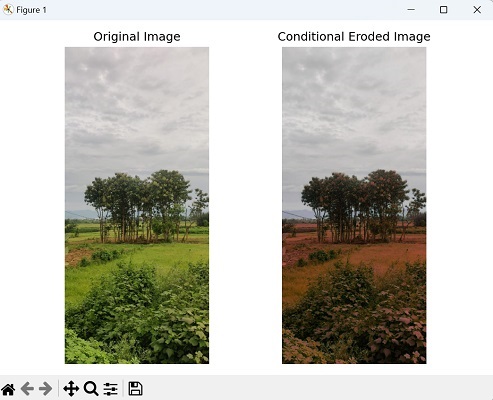
In the following example, we are performing the conditional erosion on an image by scaling down its pixel intensity −
import mahotas as mh
import numpy as np
import matplotlib.pyplot as plt
image= mh.imread('nature.jpeg')
# Define the scaling factor
scale_factor = 0.5
# Scale down the intensity by multiplying with the scale factor
scaled_image = image * scale_factor
# Convert the scaled image to the appropriate data type
scaled_image = scaled_image.astype(np.uint8)
conditional_eroded_image = mh.cerode(image, scaled_image)
# Create a figure with subplots
fig, axes = plt.subplots(1, 2, figsize=(7,5 ))
# Display the original image
axes[0].imshow(image)
axes[0].set_title('Original Image')
axes[0].axis('off')
# Display the conditional eroded image
axes[1].imshow(conditional_eroded_image, cmap='gray')
axes[1].set_title('Conditional Eroded Image')
axes[1].axis('off')
# Adjust the layout and display the plot
plt.tight_layout()
plt.show()
Output
After executing the above code, we get the following output −
Using Structuring Element
To perform conditional erosion using structuring element in Mahotas, first, we need to define the condition based on which the erosion will be applied. For example, you can specify a condition based on pixel intensity or provide a binary mask.
Next, choose a structuring element that defines the neighborhood for erosion. Mahotas provides several pre−defined structuring elements, such as disks and squares, which you can select based on the desired shape and size.
Finally, retrieve the resulting image, which will contain the erosion effects only where the condition is satisfied.
Example
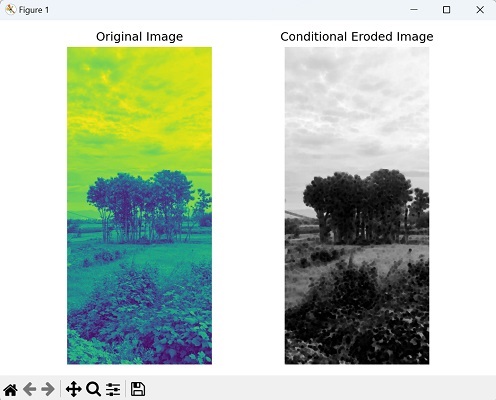
In here, we are trying to perform conditional erosion on an image using structuring elements −
import mahotas as mh
import numpy as np
import matplotlib.pyplot as plt
image= mh.imread('nature.jpeg', as_grey = True).astype(np.uint8)
# Define the condition based on pixel intensity
condition = image > 0.5
# Define a structuring element for erosion
structuring_element = mh.disk(5)
conditional_eroded_image = mh.cerode(image, condition, structuring_element)
# Create a figure with subplots
fig, axes = plt.subplots(1, 2, figsize=(7,5 ))
# Display the original image
axes[0].imshow(image)
axes[0].set_title('Original Image')
axes[0].axis('off')
# Display the conditional eroded image
axes[1].imshow(conditional_eroded_image, cmap='gray')
axes[1].set_title('Conditional Eroded Image')
axes[1].axis('off')
# Adjust the layout and display the plot
plt.tight_layout()
plt.show()
Output
The output obtained is as shown below −
Using a Custom Condition Function
We can also perform conditional erosion on an image using a custom condition function.
To achieve this, we first define a custom condition function that determines which pixels should undergo erosion.
Next, choose a structuring element to define the shape and size of erosion operation. Finally, perform the conditional erosion and retrieve the eroded image.
Example
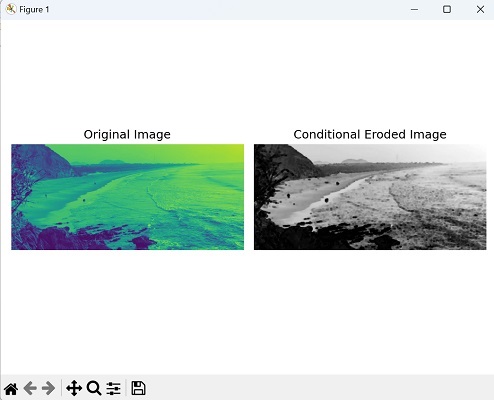
Now, we are dilating an image using a custom condition function −
import mahotas as mh
import numpy as np
import matplotlib.pyplot as plt
# Load image
image = mh.imread('sea.bmp', as_grey=True).astype(np.uint8)
# Define a custom condition function
def custom_condition(pixel_value):
   return pixel_value > 0.5
# Define a structuring element
structuring_element = mh.disk(5)
# Create a binary mask based on the custom condition function
condition = custom_condition(image)
# Perform conditional erosion
conditional_eroded_image = mh.cerode(image, condition, structuring_element)
# Create a figure with subplots
fig, axes = plt.subplots(1, 2, figsize=(7,5 ))
# Display the original image
axes[0].imshow(image)
axes[0].set_title('Original Image')
axes[0].axis('off')
# Display the conditional eroded image
axes[1].imshow(conditional_eroded_image, cmap='gray')
axes[1].set_title('Conditional Eroded Image')
axes[1].axis('off')
# Adjust the layout and display the plot
plt.tight_layout()
plt.show()
Output
Following is the output of the above code −