- Mahotas - Home
- Mahotas - Introduction
- Mahotas - Computer Vision
- Mahotas - History
- Mahotas - Features
- Mahotas - Installation
- Mahotas Handling Images
- Mahotas - Handling Images
- Mahotas - Loading an Image
- Mahotas - Loading Image as Grey
- Mahotas - Displaying an Image
- Mahotas - Displaying Shape of an Image
- Mahotas - Saving an Image
- Mahotas - Centre of Mass of an Image
- Mahotas - Convolution of Image
- Mahotas - Creating RGB Image
- Mahotas - Euler Number of an Image
- Mahotas - Fraction of Zeros in an Image
- Mahotas - Getting Image Moments
- Mahotas - Local Maxima in an Image
- Mahotas - Image Ellipse Axes
- Mahotas - Image Stretch RGB
- Mahotas Color-Space Conversion
- Mahotas - Color-Space Conversion
- Mahotas - RGB to Gray Conversion
- Mahotas - RGB to LAB Conversion
- Mahotas - RGB to Sepia
- Mahotas - RGB to XYZ Conversion
- Mahotas - XYZ to LAB Conversion
- Mahotas - XYZ to RGB Conversion
- Mahotas - Increase Gamma Correction
- Mahotas - Stretching Gamma Correction
- Mahotas Labeled Image Functions
- Mahotas - Labeled Image Functions
- Mahotas - Labeling Images
- Mahotas - Filtering Regions
- Mahotas - Border Pixels
- Mahotas - Morphological Operations
- Mahotas - Morphological Operators
- Mahotas - Finding Image Mean
- Mahotas - Cropping an Image
- Mahotas - Eccentricity of an Image
- Mahotas - Overlaying Image
- Mahotas - Roundness of Image
- Mahotas - Resizing an Image
- Mahotas - Histogram of Image
- Mahotas - Dilating an Image
- Mahotas - Eroding Image
- Mahotas - Watershed
- Mahotas - Opening Process on Image
- Mahotas - Closing Process on Image
- Mahotas - Closing Holes in an Image
- Mahotas - Conditional Dilating Image
- Mahotas - Conditional Eroding Image
- Mahotas - Conditional Watershed of Image
- Mahotas - Local Minima in Image
- Mahotas - Regional Maxima of Image
- Mahotas - Regional Minima of Image
- Mahotas - Advanced Concepts
- Mahotas - Image Thresholding
- Mahotas - Setting Threshold
- Mahotas - Soft Threshold
- Mahotas - Bernsen Local Thresholding
- Mahotas - Wavelet Transforms
- Making Image Wavelet Center
- Mahotas - Distance Transform
- Mahotas - Polygon Utilities
- Mahotas - Local Binary Patterns
- Threshold Adjacency Statistics
- Mahotas - Haralic Features
- Weight of Labeled Region
- Mahotas - Zernike Features
- Mahotas - Zernike Moments
- Mahotas - Rank Filter
- Mahotas - 2D Laplacian Filter
- Mahotas - Majority Filter
- Mahotas - Mean Filter
- Mahotas - Median Filter
- Mahotas - Otsu's Method
- Mahotas - Gaussian Filtering
- Mahotas - Hit & Miss Transform
- Mahotas - Labeled Max Array
- Mahotas - Mean Value of Image
- Mahotas - SURF Dense Points
- Mahotas - SURF Integral
- Mahotas - Haar Transform
- Highlighting Image Maxima
- Computing Linear Binary Patterns
- Getting Border of Labels
- Reversing Haar Transform
- Riddler-Calvard Method
- Sizes of Labelled Region
- Mahotas - Template Matching
- Speeded-Up Robust Features
- Removing Bordered Labelled
- Mahotas - Daubechies Wavelet
- Mahotas - Sobel Edge Detection
Mahotas - Displaying Shape of an Image
When working with image data, there are scenarios when we need to display the shape of an image.
Displaying the shape of an image refers to revealing the dimensions and characteristics of the image, such as its width, height, and color channels; where height corresponds to the number of rows, width corresponds to the number of columns, and channels indicate the number of color channels in the image (e.g., 3 for RGB images).
Displaying the Shape of an Image in Mahotas
In mahotas, we can display the shape of an image using the shape attribute of a NumPy array, which represents the image. By accessing this attribute, we can obtain the dimensions of the image and determine the appropriate operations to perform based on its shape.
Let us discuss different steps and functions offered by Mahotas to extract and visualize the shape information, along with practical examples.
Step1: Importing and Loading Images
To begin, first we need to import the Mahotas library and load the image we want to analyze. Once Mahotas is installed, we can start working with image shape analysis.
Step 2: Displaying the shape of an image
To display the shape of an image in mahotas, we can use the shape attribute of a NumPy array.
The shape attribute returns a tuple of integers representing the dimensions of the array. In the case of an image, it will provide information about its width, height, and channels.
image_shape = image.shape
print("Image Shape:", image_shape)
This will print the shape of the loaded image in the format (height, width, channels).
Step 3: Extracting Individual Dimensions
When we talk about extracting individual dimensions of the shape in Mahotas, we are referring to obtaining specific information about the size and color components of an image.
In simpler terms, an image has different properties like its height, width, and the number of color channels (such as red, green, and blue). Extracting individual dimensions means isolating and getting these specific pieces of information separately.
height = image_shape[0]
width = image_shape[1]
channels = image_shape[2]
print("Height:", height)
print("Width:", width)
print("Channels:", channels)
By executing this code, we will access the dimensions of the image using indexing where,
The first index corresponds to the height,
The second index corresponds to the width
The third index corresponds to the number of channels.
This will give the individual dimensions of the image.
Step 4: Checking for Grayscale Images
The Grayscale images are black and white images, where each pixel represents the intensity or brightness of that particular point. It does not have any color information. Think of it as a black and white photograph.
Sometimes, we encounter grayscale images, which have only one channel instead of the usual three channels for color images (Red, Green, and Blue). To determine if an image is grayscale, we can check if the number of channels is equal to 1.
is_grayscale = channels == 1
if is_grayscale:
   print("The image is grayscale.")
else:
   print("The image is not grayscale.")
By executing this code, you will find out whether the loaded image is grayscale or not. Based on the result, we can proceed with the appropriate analysis.
Step 5: Displaying the Shape Information on the Image
Now, let's explore how to display shape information on the image itself. We can draw shapes or add text overlays to highlight specific shape characteristics. This can be useful when presenting or saving the image with annotated shape information.
import matplotlib.pyplot as plt
# Create a figure and axes
fig, ax = plt.subplots()
# Display the image
ax.imshow(image)
# Add text for shape information
ax.text(10, 20, f"Shape: {image_shape}", color='white', fontsize=10,
bbox=dict(facecolor='black'))
# Remove axis ticks
ax.set_xticks([])
ax.set_yticks([])
# Show the figure
plt.show()
When we will execute this code, it will display the image with the shape information overlaid on it. The shape information will be positioned at the specified coordinates, and the text will be displayed in white color on a black bounding box, making it more visible on the image.
Complete Example
Now, let us look at the complete code that encompasses all the steps discussed above −
# Installing the library
import mahotas as ms
import matplotlib.pyplot as mtplt
# Loading the image
image = ms.imread('sun.png')
# Displaying the shape of an image
image_shape = image.shape
print("Image Shape:", image_shape)
# Extracting individual dimensions
height = image_shape[0]
width = image_shape[1]
channels = image_shape[2]
print("Height:", height)
print("Width:", width)
print("Channels:", channels)
# Checking if the image is grayscale
is_grayscale = channels == 1
if is_grayscale:
   print("The image is grayscale.")
else:
   print("The image is not grayscale.")
# Create a figure and axis
fig, ax = mtplt.subplots()
# Display the image
ax.imshow(image)
# Add text for shape information
ax.text(350, 200, f"Shape: {image_shape}", color='white', fontsize=8,
bbox=dict(facecolor='green'))
# Remove axis ticks
ax.set_xticks([])
ax.set_yticks([])
# Display the image
ax.imshow(image)
# Add text overlay for dimensions
text = f"Dimensions: {width}x{height}x{channels}" if not is_grayscale else
f"Dimensions: {width}x{height} (Grayscale)"
ax.text(18, 100, text, color='red', fontsize=12, fontweight='bold')
# Remove axis ticks and labels
ax.axis('off')
# Show the image with shape information
mtplt.show()
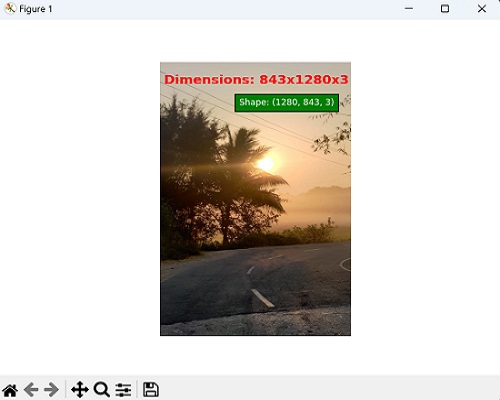
Output
After executing the above code, we get the following output−
Image Shape: (1280, 843, 3)
Height: 1280
Width: 843
Channels: 3
The image is not grayscale.