- Mahotas - Home
- Mahotas - Introduction
- Mahotas - Computer Vision
- Mahotas - History
- Mahotas - Features
- Mahotas - Installation
- Mahotas Handling Images
- Mahotas - Handling Images
- Mahotas - Loading an Image
- Mahotas - Loading Image as Grey
- Mahotas - Displaying an Image
- Mahotas - Displaying Shape of an Image
- Mahotas - Saving an Image
- Mahotas - Centre of Mass of an Image
- Mahotas - Convolution of Image
- Mahotas - Creating RGB Image
- Mahotas - Euler Number of an Image
- Mahotas - Fraction of Zeros in an Image
- Mahotas - Getting Image Moments
- Mahotas - Local Maxima in an Image
- Mahotas - Image Ellipse Axes
- Mahotas - Image Stretch RGB
- Mahotas Color-Space Conversion
- Mahotas - Color-Space Conversion
- Mahotas - RGB to Gray Conversion
- Mahotas - RGB to LAB Conversion
- Mahotas - RGB to Sepia
- Mahotas - RGB to XYZ Conversion
- Mahotas - XYZ to LAB Conversion
- Mahotas - XYZ to RGB Conversion
- Mahotas - Increase Gamma Correction
- Mahotas - Stretching Gamma Correction
- Mahotas Labeled Image Functions
- Mahotas - Labeled Image Functions
- Mahotas - Labeling Images
- Mahotas - Filtering Regions
- Mahotas - Border Pixels
- Mahotas - Morphological Operations
- Mahotas - Morphological Operators
- Mahotas - Finding Image Mean
- Mahotas - Cropping an Image
- Mahotas - Eccentricity of an Image
- Mahotas - Overlaying Image
- Mahotas - Roundness of Image
- Mahotas - Resizing an Image
- Mahotas - Histogram of Image
- Mahotas - Dilating an Image
- Mahotas - Eroding Image
- Mahotas - Watershed
- Mahotas - Opening Process on Image
- Mahotas - Closing Process on Image
- Mahotas - Closing Holes in an Image
- Mahotas - Conditional Dilating Image
- Mahotas - Conditional Eroding Image
- Mahotas - Conditional Watershed of Image
- Mahotas - Local Minima in Image
- Mahotas - Regional Maxima of Image
- Mahotas - Regional Minima of Image
- Mahotas - Advanced Concepts
- Mahotas - Image Thresholding
- Mahotas - Setting Threshold
- Mahotas - Soft Threshold
- Mahotas - Bernsen Local Thresholding
- Mahotas - Wavelet Transforms
- Making Image Wavelet Center
- Mahotas - Distance Transform
- Mahotas - Polygon Utilities
- Mahotas - Local Binary Patterns
- Threshold Adjacency Statistics
- Mahotas - Haralic Features
- Weight of Labeled Region
- Mahotas - Zernike Features
- Mahotas - Zernike Moments
- Mahotas - Rank Filter
- Mahotas - 2D Laplacian Filter
- Mahotas - Majority Filter
- Mahotas - Mean Filter
- Mahotas - Median Filter
- Mahotas - Otsu's Method
- Mahotas - Gaussian Filtering
- Mahotas - Hit & Miss Transform
- Mahotas - Labeled Max Array
- Mahotas - Mean Value of Image
- Mahotas - SURF Dense Points
- Mahotas - SURF Integral
- Mahotas - Haar Transform
- Highlighting Image Maxima
- Computing Linear Binary Patterns
- Getting Border of Labels
- Reversing Haar Transform
- Riddler-Calvard Method
- Sizes of Labelled Region
- Mahotas - Template Matching
- Speeded-Up Robust Features
- Removing Bordered Labelled
- Mahotas - Daubechies Wavelet
- Mahotas - Sobel Edge Detection
Mahotas - Labeled Max Array
A labeled max array refers to an array that stores the maximum intensity value of each region in a labeled image. To find the maximum intensity value of a region, every pixel in that region is examined. Then, the intensity value of the brightest pixel is selected as the maximum intensity value. In simple terms, labeled max arrays are used to find the brightest regions of an image.
For example, let's assume we have a region which consists of three pixels. The intensity value of the three pixels is 0.5, 0.2, and 0.8 respectively. Then the maximum intensity value of the region will be 0.8.
Labeled Max Array in Mahotas
In Mahotas, we can use the mahotas.labeled.labeled_max() function to create a labeled max array. The function iteratively searches for the brightest pixel in a region. Then it stores the intensity value of the brightest pixel in an array.
The resultant array is a labeled max array, having the maximum intensity value of each region of the image.
The mahotas.labeled.labeled_max() function
The mahotas.labeled.labeled_max() function takes an image and a labeled image as inputs. It returns an array that contains the maximum intensity value of each labeled region.
Syntax
Following is the basic syntax of the labeled_max() function in mahotas −
mahotas.labeled.labeled_max(array, labeled, minlength=None)
Where,
array − It is the input image.
labeled − It is the labeled image.
minlength (optional) − It specifies the minimum number of regions to include in the output array (default is None).
Example
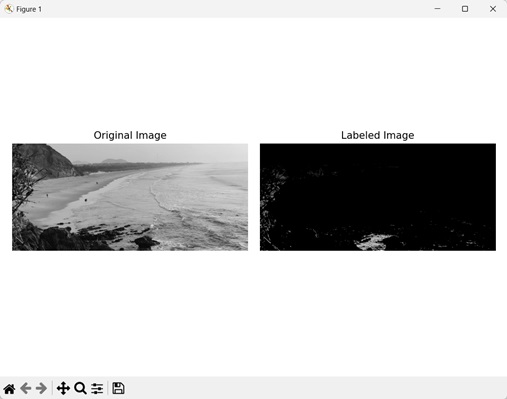
In the following example, we are finding the labeled max arrays in a labeled image using the labeled_max() function.
import mahotas as mh
import numpy as np
import matplotlib.pyplot as mtplt
# Loading the images
image = mh.imread('sea.bmp')
# Converting it to grayscale
image = mh.colors.rgb2gray(image).astype(np.uint8)
# Applying thresholding
threshold = mh.thresholding.rc(image)
threshold_image = image > threshold
# Labeling the image
label, num_objects = mh.label(threshold_image)
# Getting the labeled max array
labeled_max = mh.labeled.labeled_max(image, label)
# Printing the labeled max array
print('Labeled max array:', labeled_max)
# Creating a figure and axes for subplots
fig, axes = mtplt.subplots(1, 2)
# Displaying the original image
axes[0].imshow(image, cmap='gray')
axes[0].set_title('Original Image')
axes[0].set_axis_off()
# Displaying the labeled image
axes[1].imshow(label, cmap='gray')
axes[1].set_title('Labeled Image')
axes[1].set_axis_off()
# Adjusting spacing between subplots
mtplt.tight_layout()
# Showing the figures
mtplt.show()
Output
Following is the output of the above code −
Labeled max array: [107 111 129 ... 141 119 109]
The image obtained is as follows −
Labeled Max Arrays of a Random Boolean Image
We can also find the labeled max arrays of a random Boolean image. A random boolean image refers to an image where each pixel has a value of either 0 or 1. The foreground pixels are represented by '1', and the background pixels are represented by '0'.
In mahotas, to find the labeled max arrays of a random Boolean image, we first need to generate a random boolean image of a specific size using the np.zeros() function.
This image initially consists of only background pixels. We then assign integer values to a few portions of the image to create distinct regions.
Then, we find the labeled max arrays of the image using the labeled_max() function.
Example
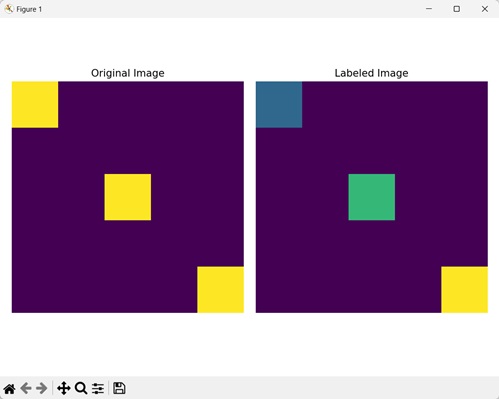
In the example mentioned below, we are finding the labeled max arrays of a random boolean image.
import mahotas as mh
import numpy as np
import matplotlib.pyplot as mtplt
# Creating a random image
image = np.zeros((10, 10), bool)
# Assigning values to the regions
image[:2, :2] = 1
image[4:6, 4:6] = 1
image[8:, 8:] = 1
# Labeling the image
label, num_objects = mh.label(image)
# Random sampling
random_sample = np.random.random_sample(image.shape)
# Getting the labeled max array
labeled_max = mh.labeled.labeled_max(random_sample, label)
# Printing the labeled max array
print('Labeled max array')
for i, intensity in enumerate(labeled_max):
   print('Region', i, ':', intensity)
# Creating a figure and axes for subplots
fig, axes = mtplt.subplots(1, 2)
# Displaying the original image
axes[0].imshow(image)
axes[0].set_title('Original Image')
axes[0].set_axis_off()
# Displaying the labeled image
axes[1].imshow(label)
axes[1].set_title('Labeled Image')
axes[1].set_axis_off()
# Adjusting spacing between subplots
mtplt.tight_layout()
# Showing the figures
mtplt.show()
Output
Output of the above code is as follows −
Labeled max array
Region 0 : 0.9950607583625318
Region 1 : 0.8626363785944107
Region 2 : 0.6343883551171169
Region 3 : 0.8162320509314726
We get the following image as output −