- Mahotas - Home
- Mahotas - Introduction
- Mahotas - Computer Vision
- Mahotas - History
- Mahotas - Features
- Mahotas - Installation
- Mahotas Handling Images
- Mahotas - Handling Images
- Mahotas - Loading an Image
- Mahotas - Loading Image as Grey
- Mahotas - Displaying an Image
- Mahotas - Displaying Shape of an Image
- Mahotas - Saving an Image
- Mahotas - Centre of Mass of an Image
- Mahotas - Convolution of Image
- Mahotas - Creating RGB Image
- Mahotas - Euler Number of an Image
- Mahotas - Fraction of Zeros in an Image
- Mahotas - Getting Image Moments
- Mahotas - Local Maxima in an Image
- Mahotas - Image Ellipse Axes
- Mahotas - Image Stretch RGB
- Mahotas Color-Space Conversion
- Mahotas - Color-Space Conversion
- Mahotas - RGB to Gray Conversion
- Mahotas - RGB to LAB Conversion
- Mahotas - RGB to Sepia
- Mahotas - RGB to XYZ Conversion
- Mahotas - XYZ to LAB Conversion
- Mahotas - XYZ to RGB Conversion
- Mahotas - Increase Gamma Correction
- Mahotas - Stretching Gamma Correction
- Mahotas Labeled Image Functions
- Mahotas - Labeled Image Functions
- Mahotas - Labeling Images
- Mahotas - Filtering Regions
- Mahotas - Border Pixels
- Mahotas - Morphological Operations
- Mahotas - Morphological Operators
- Mahotas - Finding Image Mean
- Mahotas - Cropping an Image
- Mahotas - Eccentricity of an Image
- Mahotas - Overlaying Image
- Mahotas - Roundness of Image
- Mahotas - Resizing an Image
- Mahotas - Histogram of Image
- Mahotas - Dilating an Image
- Mahotas - Eroding Image
- Mahotas - Watershed
- Mahotas - Opening Process on Image
- Mahotas - Closing Process on Image
- Mahotas - Closing Holes in an Image
- Mahotas - Conditional Dilating Image
- Mahotas - Conditional Eroding Image
- Mahotas - Conditional Watershed of Image
- Mahotas - Local Minima in Image
- Mahotas - Regional Maxima of Image
- Mahotas - Regional Minima of Image
- Mahotas - Advanced Concepts
- Mahotas - Image Thresholding
- Mahotas - Setting Threshold
- Mahotas - Soft Threshold
- Mahotas - Bernsen Local Thresholding
- Mahotas - Wavelet Transforms
- Making Image Wavelet Center
- Mahotas - Distance Transform
- Mahotas - Polygon Utilities
- Mahotas - Local Binary Patterns
- Threshold Adjacency Statistics
- Mahotas - Haralic Features
- Weight of Labeled Region
- Mahotas - Zernike Features
- Mahotas - Zernike Moments
- Mahotas - Rank Filter
- Mahotas - 2D Laplacian Filter
- Mahotas - Majority Filter
- Mahotas - Mean Filter
- Mahotas - Median Filter
- Mahotas - Otsu's Method
- Mahotas - Gaussian Filtering
- Mahotas - Hit & Miss Transform
- Mahotas - Labeled Max Array
- Mahotas - Mean Value of Image
- Mahotas - SURF Dense Points
- Mahotas - SURF Integral
- Mahotas - Haar Transform
- Highlighting Image Maxima
- Computing Linear Binary Patterns
- Getting Border of Labels
- Reversing Haar Transform
- Riddler-Calvard Method
- Sizes of Labelled Region
- Mahotas - Template Matching
- Speeded-Up Robust Features
- Removing Bordered Labelled
- Mahotas - Daubechies Wavelet
- Mahotas - Sobel Edge Detection
Mahotas - Conditional Watershed of Image
The term "watershed" is derived from the concept of a physical watershed, which is the boundary line separating different drainage basins. Similarly, the watershed algorithm aims to find boundaries or regions of separation in an image.
The watershed algorithm is a popular method used for image segmentation, which is the process of dividing an image into different regions.
Therefore, in image processing, a watershed image refers to an image that has undergone a process called watershed segmentation.
The watershed segmentation technique treats the pixel intensities in the image as a topographic surface, where the bright areas represent high elevations and the dark areas represent low elevations.
Watershed in Mahotas
Mahotas provides the conditional watershed function instead of the traditional watershed algorithm.
The conditional watershed in Mahotas is an enhanced version of the watershed algorithm that allows us to guide the segmentation process by providing specific markers.
Let us see the step−by−step procedure of how conditional watershed algorithm works in Mahotas −
Step 1 − Imagine we have an image and we want to divide it into different regions. With conditional watershed, we can mark certain areas in the image as markers that represent the regions we are interested in.
Step 2 − The algorithm then starts by filling these marked areas with water. The water will only flow within each marked region and won't cross the boundaries of other markers.
Step 3 − The result is a segmented image where each region is delineated by the boundaries defined by the markers you provided.
The mahotas.cwatershed() function
The cwatershed() function in Mahotas takes two inputs− the input image and a marker image, and returns an an output image which is segmented into distinct regions.
The marker image is a binary image where the foreground pixels (Boolean value 1) represent the boundaries for different regions.
Syntax
Following is the basic syntax of cwatershed() function in mahotas −
mahotas.cwatershed(surface, markers, Bc=None, return_lines=False) W, WL =
cwatershed(surface, markers, Bc=None, return_lines=True)
Parameters
The parameters accepted by the cwatershed() function is as follows −
surface − It represents the input image on which watershed segmentation will be performed. It is usually a grayscale image.
markers − It represents the markers for the watershed segmentation. The markers indicate regions of interest in an image.
Bc (optional) − It represents the structuring element used for neighborhood operations. If set to None, a default connectivity is used.
return_lines − It is a boolean flag that specifies whether to return the watershed lines in addition to the labeled image. If True, the function returns both the labeled image and the watershed lines.
If False, only the labeled image is returned. By default, it is set to False.
Return Values
W or WL − It represents the labeled image obtained from the watershed segmentation, where each region is assigned a unique label. The shape of the labeled image is the same as the input image.
WL (optional) − This is only returned when return_lines parameter is set to True. It represents the watershed lines, which are the boundaries between the segmented regions in the image.
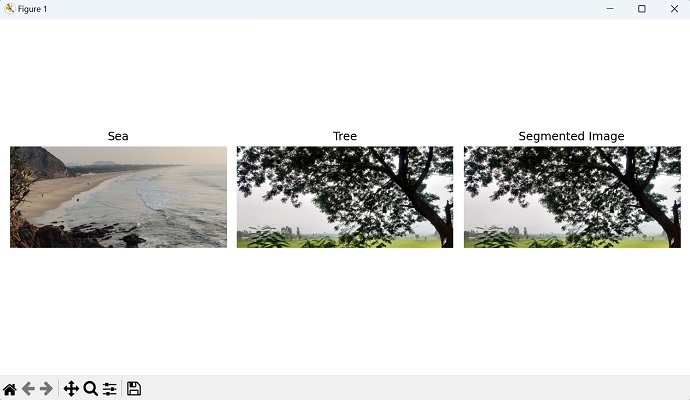
Example
In the following example, we are trying to display the basic conditional watershed segmentation of an image −
import mahotas as mh
import matplotlib.pyplot as plt
# Loading the input image
image = mh.imread('sea.bmp')
# Creating markers or seeds
markers = mh.imread('tree.tiff')
# Perform conditional watershed segmentation
segmented_image = mh.cwatershed(image, markers)
# Display all three images in one plot
plt.figure(figsize=(10, 5))
# Display image1
plt.subplot(1, 3, 1)
plt.imshow(image)
plt.title('Sea')
plt.axis('off')
# Display image2
plt.subplot(1, 3, 2)
plt.imshow(markers)
plt.title('Tree')
plt.axis('off')
# Display the segmented image
plt.subplot(1, 3, 3)
plt.imshow(segmented_image, cmap='gray')
plt.title('Segmented Image')
plt.axis('off')
plt.tight_layout()
plt.show()
Output
The output produced is as follows −
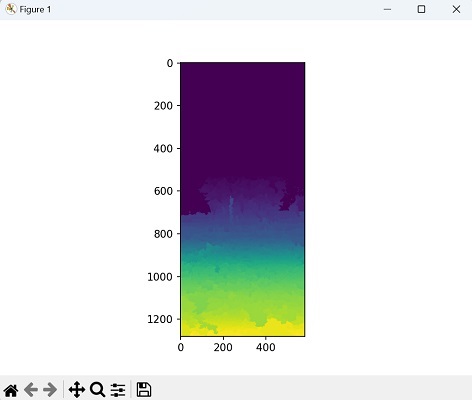
Conditional Watershed with Custom Structuring Element
A structuring element is a small binary image commonly represented as a matrix. It is used to analyze the local neighborhood of a reference pixel.
In the context of conditional watershed, a custom structuring element allows us to define the connectivity between pixels during the watershed process.
By customizing the structuring element, we can control how the the neighborhood of each pixel influences segmentation of an image.
Example
import mahotas as mh
import numpy as np
from pylab import imshow, show
# Load the image
image = mh.imread('nature.jpeg')
# Convert the image to grayscale
image_gray = mh.colors.rgb2grey(image).astype(np.uint8)
# Threshold the image
threshold = mh.thresholding.otsu(image_gray)
image_thresholded = image_gray > threshold
# Perform conditional watershed with custom structuring element
struct_element = np.array([[0, 1, 0], [1, 1, 1], [0, 1, 0]])
labels, _ = mh.label(image_thresholded, struct_element)
watershed = mh.cwatershed(image_gray.max() - image_gray, labels)
# Show the result
imshow(watershed)
show()
Output
Output of the above code is as follows −