- Mahotas - Home
- Mahotas - Introduction
- Mahotas - Computer Vision
- Mahotas - History
- Mahotas - Features
- Mahotas - Installation
- Mahotas Handling Images
- Mahotas - Handling Images
- Mahotas - Loading an Image
- Mahotas - Loading Image as Grey
- Mahotas - Displaying an Image
- Mahotas - Displaying Shape of an Image
- Mahotas - Saving an Image
- Mahotas - Centre of Mass of an Image
- Mahotas - Convolution of Image
- Mahotas - Creating RGB Image
- Mahotas - Euler Number of an Image
- Mahotas - Fraction of Zeros in an Image
- Mahotas - Getting Image Moments
- Mahotas - Local Maxima in an Image
- Mahotas - Image Ellipse Axes
- Mahotas - Image Stretch RGB
- Mahotas Color-Space Conversion
- Mahotas - Color-Space Conversion
- Mahotas - RGB to Gray Conversion
- Mahotas - RGB to LAB Conversion
- Mahotas - RGB to Sepia
- Mahotas - RGB to XYZ Conversion
- Mahotas - XYZ to LAB Conversion
- Mahotas - XYZ to RGB Conversion
- Mahotas - Increase Gamma Correction
- Mahotas - Stretching Gamma Correction
- Mahotas Labeled Image Functions
- Mahotas - Labeled Image Functions
- Mahotas - Labeling Images
- Mahotas - Filtering Regions
- Mahotas - Border Pixels
- Mahotas - Morphological Operations
- Mahotas - Morphological Operators
- Mahotas - Finding Image Mean
- Mahotas - Cropping an Image
- Mahotas - Eccentricity of an Image
- Mahotas - Overlaying Image
- Mahotas - Roundness of Image
- Mahotas - Resizing an Image
- Mahotas - Histogram of Image
- Mahotas - Dilating an Image
- Mahotas - Eroding Image
- Mahotas - Watershed
- Mahotas - Opening Process on Image
- Mahotas - Closing Process on Image
- Mahotas - Closing Holes in an Image
- Mahotas - Conditional Dilating Image
- Mahotas - Conditional Eroding Image
- Mahotas - Conditional Watershed of Image
- Mahotas - Local Minima in Image
- Mahotas - Regional Maxima of Image
- Mahotas - Regional Minima of Image
- Mahotas - Advanced Concepts
- Mahotas - Image Thresholding
- Mahotas - Setting Threshold
- Mahotas - Soft Threshold
- Mahotas - Bernsen Local Thresholding
- Mahotas - Wavelet Transforms
- Making Image Wavelet Center
- Mahotas - Distance Transform
- Mahotas - Polygon Utilities
- Mahotas - Local Binary Patterns
- Threshold Adjacency Statistics
- Mahotas - Haralic Features
- Weight of Labeled Region
- Mahotas - Zernike Features
- Mahotas - Zernike Moments
- Mahotas - Rank Filter
- Mahotas - 2D Laplacian Filter
- Mahotas - Majority Filter
- Mahotas - Mean Filter
- Mahotas - Median Filter
- Mahotas - Otsu's Method
- Mahotas - Gaussian Filtering
- Mahotas - Hit & Miss Transform
- Mahotas - Labeled Max Array
- Mahotas - Mean Value of Image
- Mahotas - SURF Dense Points
- Mahotas - SURF Integral
- Mahotas - Haar Transform
- Highlighting Image Maxima
- Computing Linear Binary Patterns
- Getting Border of Labels
- Reversing Haar Transform
- Riddler-Calvard Method
- Sizes of Labelled Region
- Mahotas - Template Matching
- Speeded-Up Robust Features
- Removing Bordered Labelled
- Mahotas - Daubechies Wavelet
- Mahotas - Sobel Edge Detection
Mahotas - Handling Images
Mahotas is a popular Python package for handling images and performing various operations on them. It can do many things with images, like separating them into different parts, finding edges, and recognizing objects in them.
With Mahotas, we can find all the faces in a set of pictures, or identify different types of flowers in a collection of images. We can also find the edges of objects in pictures, or make blurry pictures clearer in Mahotas.
In this tutorial, we will take a brief overview of how to use Mahotas to handle images, including how to read, write, and display images. We will also learn how to perform common image processing tasks such as filtering, segmentation, and feature extraction.
Image Handling with Mahotas
One of the key features of Mahotas is its ability to handle images in various formats, such as JPEG, PNG, and BMP. Mahotas provides us with functions for reading and writing images, as well as for converting images between different formats.
Let us learn how to read an image in Mahotas.
Reading Images
Reading images in mahotas refers to the process of loading image data from a file. To read an image in Mahotas, we can use the imread() function. This function reads an image from a file and returns a NumPy array representing the image.
Example
In the code below, we are trying to read a JPEG image named 'nature.jpeg' −
import mahotas as ms
image = ms.imread('nature.jpeg')
print ("The image is read.")
Output
This will read the image from the file 'nature.jpeg' and store it in the variable 'image' −
The image is read.
We can also display the image once we have read it as discussed below.
Displaying an Image
Once you have read an image, we can display it using the matplotlib library. The matplotlib library is used for data visualization and plotting.
Example
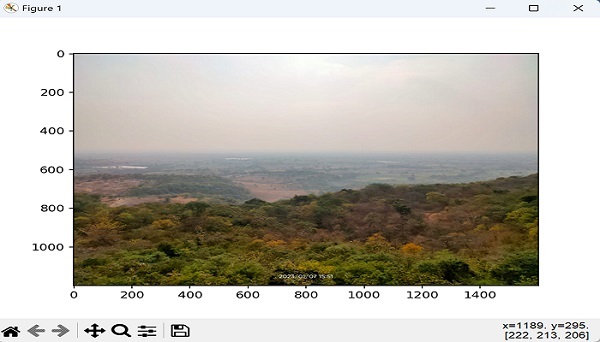
Let us display the image 'nature.jpeg, using matplotlib library as shown below −
import matplotlib.pyplot as plt
import mahotas as ms
image = ms.imread('nature.jpeg')
plt.imshow(image)
plt.show()
Output
Following is the image obtained while executing the above code−
Writing Images
Writing images in Mahotas refers to saving the image data to a file in a specific image format such as PNG, JPEG, BMP, TIFF, etc. We can use the imsave() function to write an image in Mahotas. This function is part of the image input/output (IO) module in mahotas.
Example
In the code below, we are trying to save an image named 'nature.jpeg' −
import mahotas as ms
image = ms.imread('nature.jpeg')
print ("The image is read.")
# Write the image to a file
ms.imsave('writing.jpeg', image)
print ("The image data is saved.")
Output
This will save the image to a file 'writing.jpeg' −
The image is read.
The image data is saved.
Image Processing with Mahotas
Image processing refers to a set of techniques which is used to perform several operations on images. These techniques are helpful in improving the visual quality of images, extract useful information, or prepare them for analysis.
Some common image processing tasks are filtering, segmentation, and feature extraction. In this section, we will explore some of the key image processing functions provided by Mahotas.
Filtering
In mahotas, filtering refers to modifying the appearance of an image or extracting useful information from it. This is done by applying a mathematical operation to an image. The filtering process is useful in removing noise, smoothening an image, enhancing edges, or performing other operations that help improve the quality or interpretability of an image.
Example
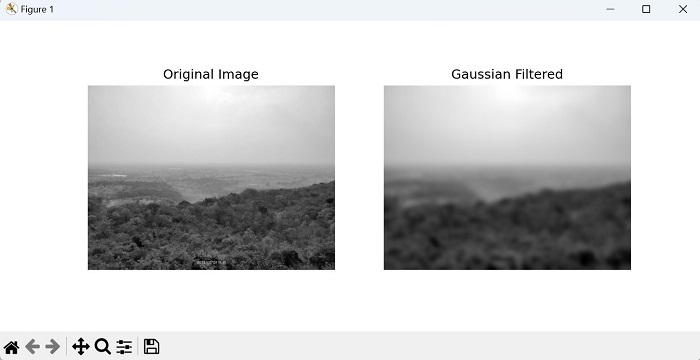
In the following example, we are trying to smooth an image using a Gaussian filter. The Gaussian filter blurs an image, which can be used to reduce noise or smooth an image −
import mahotas as ms
import numpy as np
import matplotlib.pyplot as mtplt
# Loading an image and converting it to grayscale
image = ms.imread('nature.jpeg', as_grey=True)
# Applying a Gaussian filter
# Standard deviation
sigma = 15
gaussian_filtered = ms.gaussian_filter(image, sigma)
# Displaying the original image
fig, axes = mtplt.subplots(1, 2, figsize=(9, 4))
axes[0].imshow(image, cmap='gray')
axes[0].set_title('Original Image')
axes[0].axis('off')
# Displaying the filtered image
axes[1].imshow(gaussian_filtered, cmap='gray')
axes[1].set_title('Gaussian Filtered')
axes[1].axis('off')
mtplt.show()
Output
This will smooth the original image using a Gaussian filter with a standard deviation of 15 as shown below −
Segmentation
Segmentation in mahotas refers to the process of dividing an image into meaningful regions or segments based on certain characteristics or criteria. These segments can represent different objects, regions of interest, or distinct areas within the image.
Example
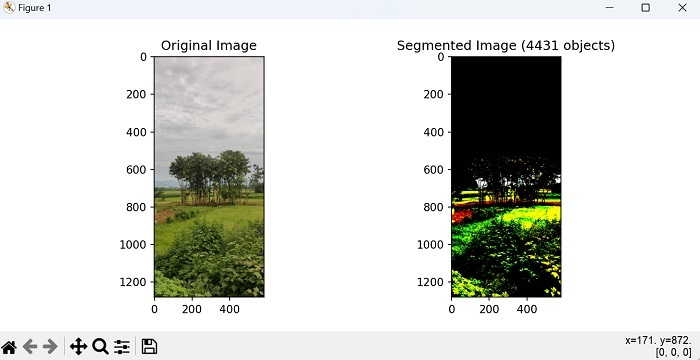
Now, let's go through a basic example of image segmentation using thresholding with Mahotas. Thresholding is used to separate objects from the background based on pixel intensity values. It simplifies an image by converting it into a binary image where eachpixel is classified as either foreground (object) or background −
import mahotas as ms
import numpy as np
import matplotlib.pyplot as mtplt
# Loading the image
image = ms.imread('nature.jpeg', as_grey=False)
# Performing thresholding
# Calculating threshold value by taking mean of image
threshold = np.mean(image)
# creating binary image
# comparing each pixel value with the threshold
binary_image = image > threshold
# Perform connected component analysis
# assigns a unique label to each connected region in the binary image
labeled_image, num_objects = ms.label(binary_image)
# Displaying the original image
fig, ax = mtplt.subplots(1, 2, figsize=(9, 4))
ax[0].imshow(image, cmap='gray')
ax[0].set_title('Original Image')
# Displaying the segmented image
ax[1].imshow(labeled_image, cmap='rainbow')
ax[1].set_title('Segmented Image ({} objects)'.format(num_objects))
mtplt.show()
Output
The output of the above code is as shown below −
Feature Extraction
Feature extraction in Mahotas refers to the process of extracting meaningful and informative features from an image. These features can represent various aspects of the image, such as texture, shape, or color, and can be used to describe and differentiate objects or regions within the image.
Example
Now, let's see an example of how to calculate Zernike moments using Mahotas. The Zernike moments are a set of numerical values that describe the shape of an object or region within an image. They provide a compact representation of the object's shape by capturing its contours and spatial characteristics −
import mahotas as ms
from mahotas.features import zernike_moments
# Loading the image
image = ms.imread('nature.jpeg', as_grey=True)
# Normalizing the image
normalized_image = ms.stretch(image)
# Specifying the radius for Zernike moments calculation
radius = 30
# Calculating Zernike moments
moments = zernike_moments(normalized_image, radius)
# Printing the resulting moments
print(moments)
Output
After executing the above code, we get a set of numerical values that describe the shape features of the image as shown below −
[0.31830989 0.01252728 0.00854837 0.00677556 0.00239216 0.00742469
0.00553204 0.00306795 0.01058855 0.00368774 0.00456233 0.01123103
0.00336877 0.00349998 0.00387494 0.0108442 0.00294575 0.00490895
0.00243368 0.01113736 0.00229705 0.00511743 0.00668574 0.0083512
0.00767699]