- VersionOne - Home
- VersionOne - Introduction
- VersionOne - Features
- VersionOne - Free Trial Access
- VersionOne - Login
- VersionOne - Dashboard
- VersionOne - Invite Users
- VersionOne - Add a Project
- VersionOne - Portfolio Planner
- VersionOne - Product Planner
- VersionOne - Backlog
- VersionOne - Story
- VersionOne - Edit Story
- VersionOne - Defects
- VersionOne - Edit Defects
- VersionOne - Release Planner
- VersionOne - Sprint Planning
- VersionOne - Sprint Scheduling
- VersionOne - Detail Planning
- VersionOne - Issues
- VersionOne - Task
- VersionOne - Templates
- VersionOne - Import Data
- VersionOne - Team Rooms
- VersionOne - Storyboard
- VersionOne - Testboard
- VersionOne - Taskboard
- VersionOne - Filters
- VersionOne - Search
- VersionOne - Conversation
- VersionOne - Collaboration
- VersionOne - Notification
- VersionOne - Estimably
VersionOne - Testboard
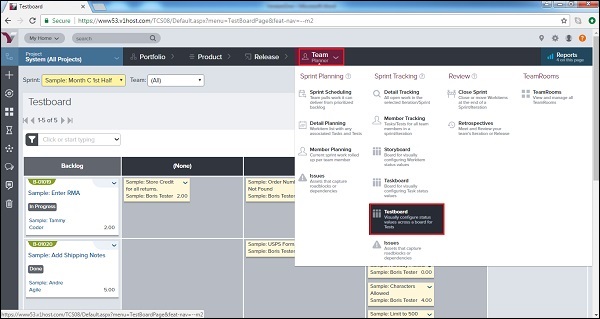
Testboard displays the list of acceptance tests for each backlog item and/or defect. It displays the current status of test as well; whether passed, failed or none. It is useful to view the status of each test to track the progress of individual tests during the testing cycle.
To access Testboard, from the main menu, select Team Planner → Testboard as shown below −
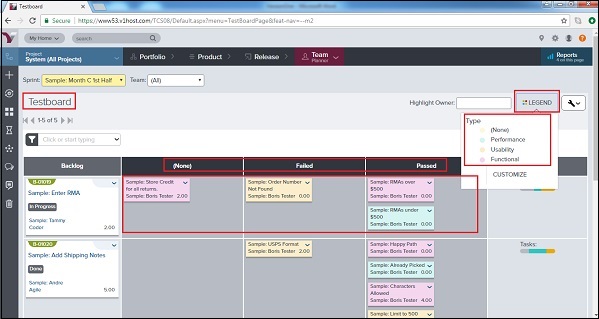
A user can select the Sprint from the top left side to see the details of the respective sprint.
Test Cards appear in different status columns on the board (for example, None, Passed and Failed).
It shows the test title, owner, and total work estimate.
Test cards are color-coded by test type (i.e., Method, Type, Manual, Automated) to give a look at the testing across project work functions.
Click the Legend button at the top right of the board to see the color representation and/or to customize the color-coding scheme by the test type.
The following screenshot displays the Testboard view −
Update Test Status
In this section, we will discuss how to update test status.
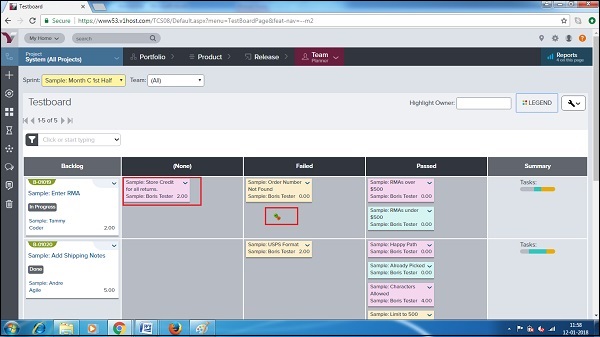
The Testboard has the following status columns None, Passed and Failed.
To update the status of a test from Testboard, go to Team Planner → Testboard.
Drag and Drop each test horizontally to a status column to update it.
Following screenshot displays how to update status −
Reports on Testboard
Reports on Testboard are data displayed in trend/charts to analyze the continuous progress. There are usually four types of reports available on Testboard.
A user can access these reports by navigating to Testboard and clicking on Reports → Name of Report present at top right as shown in the screenshot below −
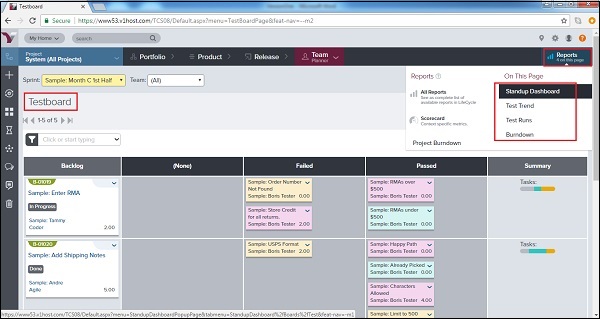
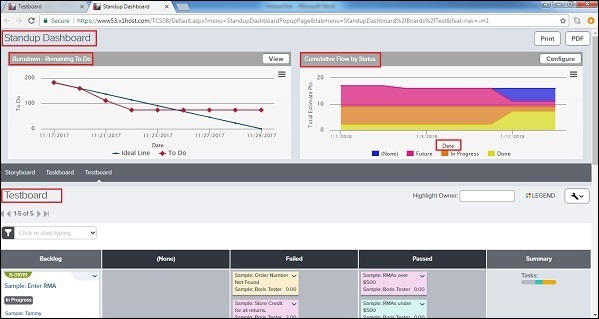
Standup Dashboard Report − It displays a high-level view of team progress through its sprint workload. The dashboard displays continuous graph of the remaining work To Do and the cumulative flow by status where date is x-axis. It also displays the current view of the Testboard. The following screenshot displays the Standup Dashboard Report −
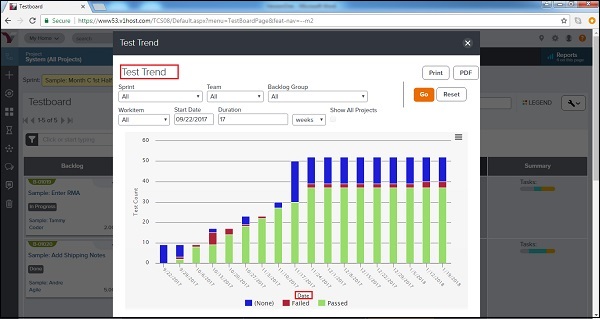
Test Trend Report − It displays the bar graph to show how the status of the tests has changed over a period of time. It displays color-coded bars; this indicates the number of tests in specific status (not yet run, passed, failed, etc.) at specific milestone dates. The following screenshot displays the Test Trend report −
Test Runs Report − It displays the bar graph showing project-level test results from an external testing system by test status (for example, not yet run, passed, failed).
Burndown Report − It displays the progress of a team through its sprint workload. It displays the amount of work done and remaining to be done (To Do) versus the expected (ideal) schedule.