- Matplotlib - Home
- Matplotlib - Introduction
- Matplotlib - Vs Seaborn
- Matplotlib - Environment Setup
- Matplotlib - Anaconda distribution
- Matplotlib - Jupyter Notebook
- Matplotlib - Pyplot API
- Matplotlib - Simple Plot
- Matplotlib - Saving Figures
- Matplotlib - Markers
- Matplotlib - Figures
- Matplotlib - Styles
- Matplotlib - Legends
- Matplotlib - Colors
- Matplotlib - Colormaps
- Matplotlib - Colormap Normalization
- Matplotlib - Choosing Colormaps
- Matplotlib - Colorbars
- Matplotlib - Working With Text
- Matplotlib - Text properties
- Matplotlib - Subplot Titles
- Matplotlib - Images
- Matplotlib - Image Masking
- Matplotlib - Annotations
- Matplotlib - Arrows
- Matplotlib - Fonts
- Matplotlib - Font Indexing
- Matplotlib - Font Properties
- Matplotlib - Scales
- Matplotlib - LaTeX
- Matplotlib - LaTeX Text Formatting in Annotations
- Matplotlib - PostScript
- Matplotlib - Mathematical Expressions
- Matplotlib - Animations
- Matplotlib - Celluloid Library
- Matplotlib - Blitting
- Matplotlib - Toolkits
- Matplotlib - Artists
- Matplotlib - Styling with Cycler
- Matplotlib - Paths
- Matplotlib - Path Effects
- Matplotlib - Transforms
- Matplotlib - Ticks and Tick Labels
- Matplotlib - Radian Ticks
- Matplotlib - Dateticks
- Matplotlib - Tick Formatters
- Matplotlib - Tick Locators
- Matplotlib - Basic Units
- Matplotlib - Autoscaling
- Matplotlib - Reverse Axes
- Matplotlib - Logarithmic Axes
- Matplotlib - Symlog
- Matplotlib - Unit Handling
- Matplotlib - Ellipse with Units
- Matplotlib - Spines
- Matplotlib - Axis Ranges
- Matplotlib - Axis Scales
- Matplotlib - Axis Ticks
- Matplotlib - Formatting Axes
- Matplotlib - Axes Class
- Matplotlib - Twin Axes
- Matplotlib - Figure Class
- Matplotlib - Multiplots
- Matplotlib - Grids
- Matplotlib - Object-oriented Interface
- Matplotlib - PyLab module
- Matplotlib - Subplots() Function
- Matplotlib - Subplot2grid() Function
- Matplotlib - Anchored Artists
- Matplotlib - Manual Contour
- Matplotlib - Coords Report
- Matplotlib - AGG filter
- Matplotlib - Ribbon Box
- Matplotlib - Fill Spiral
- Matplotlib - Findobj Method
- Matplotlib - Hyperlinks
- Matplotlib - Image Thumbnail
- Matplotlib - Plotting with Keywords
- Matplotlib - Create Logo
- Matplotlib - Multipage PDF
- Matplotlib - Multiprocessing
- Matplotlib - Print Stdout
- Matplotlib - Compound Path
- Matplotlib - Sankey Class
- Matplotlib - MRI with EEG
- Matplotlib - Stylesheets
- Matplotlib - Background Colors
- Matplotlib - Basemap
Matplotlib Events
- Matplotlib - Event Handling
- Matplotlib - Close Event
- Matplotlib - Mouse Move
- Matplotlib - Click Events
- Matplotlib - Scroll Event
- Matplotlib - Keypress Event
- Matplotlib - Pick Event
- Matplotlib - Looking Glass
- Matplotlib - Path Editor
- Matplotlib - Poly Editor
- Matplotlib - Timers
- Matplotlib - Viewlims
- Matplotlib - Zoom Window
Matplotlib Widgets
- Matplotlib - Cursor Widget
- Matplotlib - Annotated Cursor
- Matplotlib - Button Widget
- Matplotlib - Check Buttons
- Matplotlib - Lasso Selector
- Matplotlib - Menu Widget
- Matplotlib - Mouse Cursor
- Matplotlib - Multicursor
- Matplotlib - Polygon Selector
- Matplotlib - Radio Buttons
- Matplotlib - RangeSlider
- Matplotlib - Rectangle Selector
- Matplotlib - Ellipse Selector
- Matplotlib - Slider Widget
- Matplotlib - Span Selector
- Matplotlib - Textbox
Matplotlib Plotting
- Matplotlib - Line Plots
- Matplotlib - Area Plots
- Matplotlib - Bar Graphs
- Matplotlib - Histogram
- Matplotlib - Pie Chart
- Matplotlib - Scatter Plot
- Matplotlib - Box Plot
- Matplotlib - Arrow Demo
- Matplotlib - Fancy Boxes
- Matplotlib - Zorder Demo
- Matplotlib - Hatch Demo
- Matplotlib - Mmh Donuts
- Matplotlib - Ellipse Demo
- Matplotlib - Bezier Curve
- Matplotlib - Bubble Plots
- Matplotlib - Stacked Plots
- Matplotlib - Table Charts
- Matplotlib - Polar Charts
- Matplotlib - Hexagonal bin Plots
- Matplotlib - Violin Plot
- Matplotlib - Event Plot
- Matplotlib - Heatmap
- Matplotlib - Stairs Plots
- Matplotlib - Errorbar
- Matplotlib - Hinton Diagram
- Matplotlib - Contour Plot
- Matplotlib - Wireframe Plots
- Matplotlib - Surface Plots
- Matplotlib - Triangulations
- Matplotlib - Stream plot
- Matplotlib - Ishikawa Diagram
- Matplotlib - 3D Plotting
- Matplotlib - 3D Lines
- Matplotlib - 3D Scatter Plots
- Matplotlib - 3D Contour Plot
- Matplotlib - 3D Bar Plots
- Matplotlib - 3D Wireframe Plot
- Matplotlib - 3D Surface Plot
- Matplotlib - 3D Vignettes
- Matplotlib - 3D Volumes
- Matplotlib - 3D Voxels
- Matplotlib - Time Plots and Signals
- Matplotlib - Filled Plots
- Matplotlib - Step Plots
- Matplotlib - XKCD Style
- Matplotlib - Quiver Plot
- Matplotlib - Stem Plots
- Matplotlib - Visualizing Vectors
- Matplotlib - Audio Visualization
- Matplotlib - Audio Processing
Matplotlib Useful Resources
Matplotlib - Unit Handling
What is Unit Handling?
In Matplotlib library unit handling refers to the capability of the library to manage and interpret different types of units for plotting data accurately. Matplotlib allows users to specify and work with various units for defining and displaying data on plots whether they are related to length, time, angle or other physical quantities.
Key Aspects of Unit Handling in Matplotlib
The below are the key aspects of unit handling in matplotlib library.
Support for Various Units
Matplotlib supports multiple units such as pixels, inches, centimeters, points, fractions of the figure size and more. This flexibility allows users to define plot elements like positions, sizes and spacing using the unit of their choice.
Conversion and Transformation
Matplotlib handles unit conversions and transformations seamlessly. It enables automatic conversion between different units when plotting or specifying attributes such as size, location or dimensions.
Unit-Aware Functions
Many Matplotlib functions and methods are unit-aware which means they accept arguments or parameters in different units and internally manage the conversion for plotting purposes.
Functions and Techniques for Unit Handling
There are few techniques and functions available for unit handling.
Automatic Conversion
Matplotlib automatically handles unit conversion for plotting data. When using plot() function or other plotting functions the library converts data units to display units based on the chosen coordinate system.
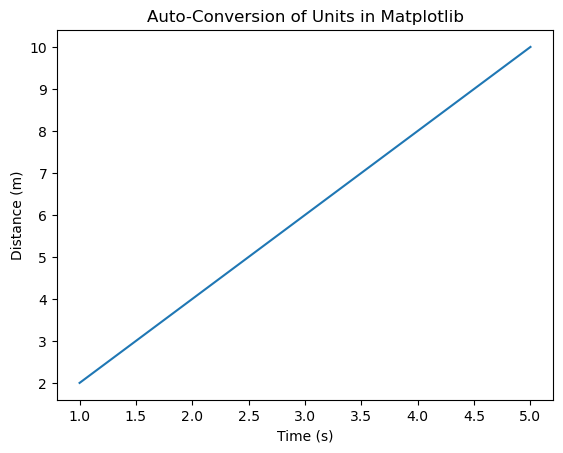
This automatic conversion simplifies the process of plotting data in Matplotlib by handling the conversion between different units without requiring explicit conversion steps from the user. Here's an example demonstrating auto-conversion in unit handling.
Example - Automatic Unit Conversion
import matplotlib.pyplot as plt

# Sample data in different units
time_seconds = [1, 2, 3, 4, 5]  # Time in seconds
distance_meters = [2, 4, 6, 8, 10]  # Distance in meters
plt.plot(time_seconds, distance_meters)  # Matplotlib handles unit conversion
plt.xlabel('Time (s)')
plt.ylabel('Distance (m)')
plt.title('Auto-Conversion of Units in Matplotlib')
plt.show()
Output
Axis Labeling
In Axis labeling we use xlabel() and ylabel() functions to label the x-axis and y-axis respectively. These functions allow us in specifying units for the axis labels.
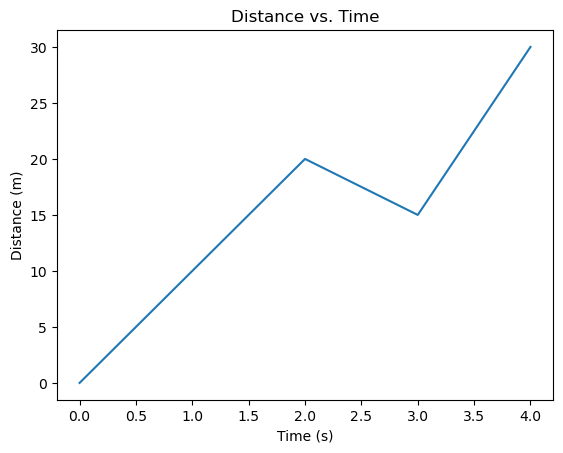
We can adjust the labels accordingly to match the units of the data being plotted. This practice helps provide context and clarity to the plotted data for anyone viewing the graph. The below is an example demonstrating how to label axes with units using Matplotlib.
Example - Labeling Axes
import matplotlib.pyplot as plt

# Sample data
time = [0, 1, 2, 3, 4]  # Time in seconds
distance = [0, 10, 20, 15, 30]  # Distance in meters

# Creating a plot
plt.plot(time, distance)

# Labeling axes with units
plt.xlabel('Time (s)')
plt.ylabel('Distance (m)')
plt.title('Distance vs. Time')
plt.show()
Output
Custom Units
For more explicit control set_units() methods for axes ax.xaxis.set_units() and ax.yaxis.set_units() can be used to explicitly set the units for the x-axis and y-axis.
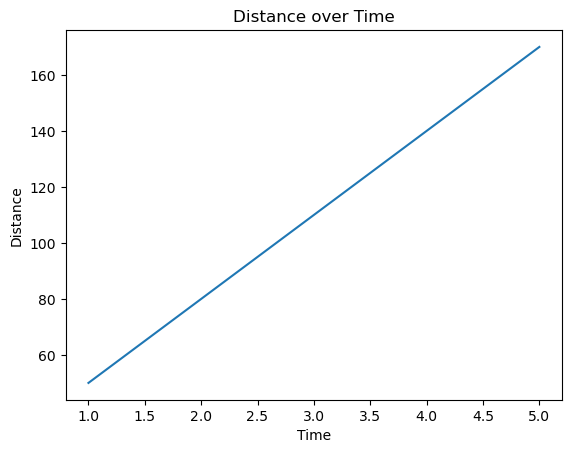
This custom axis unit handling ensures that the plot displays the data using specific units such as hours for time, kilometers for distance etc and labels the axes accordingly providing context and clarity to the visualization. Here's an example demonstrating custom axis unit handling in Matplotlib.
Example - Usage of Custom Units
import matplotlib.pyplot as plt

# Sample data
time_hours = [1, 2, 3, 4, 5]  # Time in hours
distance_km = [50, 80, 110, 140, 170]  # Distance in kilometers
fig, ax = plt.subplots()

# Plotting the data
ax.plot(time_hours, distance_km)

# Customizing x-axis and y-axis units
ax.xaxis.set_units('hours')  # Set x-axis units to hours
ax.yaxis.set_units('km')     # Set y-axis units to kilometers

# Labeling axes with units
ax.set_xlabel('Time')
ax.set_ylabel('Distance')
ax.set_title('Distance over Time')
plt.show()
Output
Unit Conversion
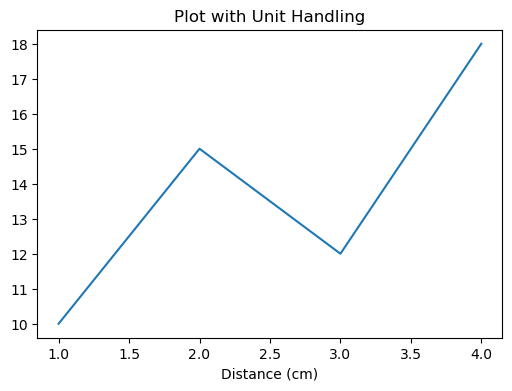
Functions like convert_xunits() and convert_yunits() within plt.gca() can convert data units to display units. Here is an example demonstrating unit conversion in unit handling in Matplotlib
Example - Unit Conversion
import matplotlib.pyplot as plt

# Specify figure size in inches
plt.figure(figsize=(6, 4))  # Width: 6 inches, Height: 4 inches

# Set x-axis label with different units
plt.xlabel('Distance (cm)')  # Using centimeters as units

# Plotting data with specific units
x = [1, 2, 3, 4]
y = [10, 15, 12, 18]
plt.plot(x, y)
plt.title('Plot with Unit Handling')
plt.show()
Output
Use Cases for Unit Handling
Consistency in Measurement − Ensuring consistent units across labels, annotations and plot elements for clarity.
Dimension-Agnostic Plotting − Plotting data regardless of the unit type such as length, time etc. with Matplotlib handling conversions and scaling appropriately.
Customization Flexibility − Allowing users to define plot attributes using their preferred units for better control over visualizations.