- Matplotlib - Home
- Matplotlib - Introduction
- Matplotlib - Vs Seaborn
- Matplotlib - Environment Setup
- Matplotlib - Anaconda distribution
- Matplotlib - Jupyter Notebook
- Matplotlib - Pyplot API
- Matplotlib - Simple Plot
- Matplotlib - Saving Figures
- Matplotlib - Markers
- Matplotlib - Figures
- Matplotlib - Styles
- Matplotlib - Legends
- Matplotlib - Colors
- Matplotlib - Colormaps
- Matplotlib - Colormap Normalization
- Matplotlib - Choosing Colormaps
- Matplotlib - Colorbars
- Matplotlib - Working With Text
- Matplotlib - Text properties
- Matplotlib - Subplot Titles
- Matplotlib - Images
- Matplotlib - Image Masking
- Matplotlib - Annotations
- Matplotlib - Arrows
- Matplotlib - Fonts
- Matplotlib - Font Indexing
- Matplotlib - Font Properties
- Matplotlib - Scales
- Matplotlib - LaTeX
- Matplotlib - LaTeX Text Formatting in Annotations
- Matplotlib - PostScript
- Matplotlib - Mathematical Expressions
- Matplotlib - Animations
- Matplotlib - Celluloid Library
- Matplotlib - Blitting
- Matplotlib - Toolkits
- Matplotlib - Artists
- Matplotlib - Styling with Cycler
- Matplotlib - Paths
- Matplotlib - Path Effects
- Matplotlib - Transforms
- Matplotlib - Ticks and Tick Labels
- Matplotlib - Radian Ticks
- Matplotlib - Dateticks
- Matplotlib - Tick Formatters
- Matplotlib - Tick Locators
- Matplotlib - Basic Units
- Matplotlib - Autoscaling
- Matplotlib - Reverse Axes
- Matplotlib - Logarithmic Axes
- Matplotlib - Symlog
- Matplotlib - Unit Handling
- Matplotlib - Ellipse with Units
- Matplotlib - Spines
- Matplotlib - Axis Ranges
- Matplotlib - Axis Scales
- Matplotlib - Axis Ticks
- Matplotlib - Formatting Axes
- Matplotlib - Axes Class
- Matplotlib - Twin Axes
- Matplotlib - Figure Class
- Matplotlib - Multiplots
- Matplotlib - Grids
- Matplotlib - Object-oriented Interface
- Matplotlib - PyLab module
- Matplotlib - Subplots() Function
- Matplotlib - Subplot2grid() Function
- Matplotlib - Anchored Artists
- Matplotlib - Manual Contour
- Matplotlib - Coords Report
- Matplotlib - AGG filter
- Matplotlib - Ribbon Box
- Matplotlib - Fill Spiral
- Matplotlib - Findobj Method
- Matplotlib - Hyperlinks
- Matplotlib - Image Thumbnail
- Matplotlib - Plotting with Keywords
- Matplotlib - Create Logo
- Matplotlib - Multipage PDF
- Matplotlib - Multiprocessing
- Matplotlib - Print Stdout
- Matplotlib - Compound Path
- Matplotlib - Sankey Class
- Matplotlib - MRI with EEG
- Matplotlib - Stylesheets
- Matplotlib - Background Colors
- Matplotlib - Basemap
Matplotlib Events
- Matplotlib - Event Handling
- Matplotlib - Close Event
- Matplotlib - Mouse Move
- Matplotlib - Click Events
- Matplotlib - Scroll Event
- Matplotlib - Keypress Event
- Matplotlib - Pick Event
- Matplotlib - Looking Glass
- Matplotlib - Path Editor
- Matplotlib - Poly Editor
- Matplotlib - Timers
- Matplotlib - Viewlims
- Matplotlib - Zoom Window
Matplotlib Widgets
- Matplotlib - Cursor Widget
- Matplotlib - Annotated Cursor
- Matplotlib - Button Widget
- Matplotlib - Check Buttons
- Matplotlib - Lasso Selector
- Matplotlib - Menu Widget
- Matplotlib - Mouse Cursor
- Matplotlib - Multicursor
- Matplotlib - Polygon Selector
- Matplotlib - Radio Buttons
- Matplotlib - RangeSlider
- Matplotlib - Rectangle Selector
- Matplotlib - Ellipse Selector
- Matplotlib - Slider Widget
- Matplotlib - Span Selector
- Matplotlib - Textbox
Matplotlib Plotting
- Matplotlib - Line Plots
- Matplotlib - Area Plots
- Matplotlib - Bar Graphs
- Matplotlib - Histogram
- Matplotlib - Pie Chart
- Matplotlib - Scatter Plot
- Matplotlib - Box Plot
- Matplotlib - Arrow Demo
- Matplotlib - Fancy Boxes
- Matplotlib - Zorder Demo
- Matplotlib - Hatch Demo
- Matplotlib - Mmh Donuts
- Matplotlib - Ellipse Demo
- Matplotlib - Bezier Curve
- Matplotlib - Bubble Plots
- Matplotlib - Stacked Plots
- Matplotlib - Table Charts
- Matplotlib - Polar Charts
- Matplotlib - Hexagonal bin Plots
- Matplotlib - Violin Plot
- Matplotlib - Event Plot
- Matplotlib - Heatmap
- Matplotlib - Stairs Plots
- Matplotlib - Errorbar
- Matplotlib - Hinton Diagram
- Matplotlib - Contour Plot
- Matplotlib - Wireframe Plots
- Matplotlib - Surface Plots
- Matplotlib - Triangulations
- Matplotlib - Stream plot
- Matplotlib - Ishikawa Diagram
- Matplotlib - 3D Plotting
- Matplotlib - 3D Lines
- Matplotlib - 3D Scatter Plots
- Matplotlib - 3D Contour Plot
- Matplotlib - 3D Bar Plots
- Matplotlib - 3D Wireframe Plot
- Matplotlib - 3D Surface Plot
- Matplotlib - 3D Vignettes
- Matplotlib - 3D Volumes
- Matplotlib - 3D Voxels
- Matplotlib - Time Plots and Signals
- Matplotlib - Filled Plots
- Matplotlib - Step Plots
- Matplotlib - XKCD Style
- Matplotlib - Quiver Plot
- Matplotlib - Stem Plots
- Matplotlib - Visualizing Vectors
- Matplotlib - Audio Visualization
- Matplotlib - Audio Processing
Matplotlib Useful Resources
- Matplotlib - Quick Guide
- Matplotlib - Cheatsheet
- Matplotlib - Useful Resources
- Matplotlib - Discussion
Matplotlib - Basic Units
What are Basic Units?
In Matplotlib basic units refer to the fundamental elements used to define and measure various aspects of a plot such as length, width, positions and coordinates. Understanding these units is crucial for accurately placing elements within a plot and controlling its overall layout.
Common Basic Units in Matplotlib
The following are the common basic units available in matplotlib library.
Points (pt)
In Matplotlib points typically refer to a unit of measurement used for specifying various visual properties within a plot such as line widths, marker sizes and text sizes. The point (pt) is a standard unit in typography and graphics often used for its device-independent size representation.
Usage of Points in Matplotlib
Line Widths − The linewidth parameter in Matplotlib functions such as plt.plot() allows us to specify the width of lines in points.
Text Sizes − The fontsize parameter in Matplotlib functions plt.xlabel(), plt.ylabel(), plt.title() enables setting the size of text in points.
Marker Sizes − The markersize parameter in plot functions such as plt.plot() defines the size of markers in points.
Figure Size − When specifying the figure size using plt.figure(figsize=(width, height)) the dimensions are in inches. However the default size might differ across systems such as 1 inch might not always equal 72 points but this is the typical convention.
Converting Points to Other Units
Matplotlib works internally with points but when setting figure sizes or dimensions it's common to use inches. As a reference 1 inch is approximately equal to 72 points.
- 1 inch = 72 points
- 1 point 0.01389 inches
Understanding and utilizing points as a unit of measurement in Matplotlib allows for precise control over the visual properties of elements within plots ensuring the desired appearance and readability.
Example - Setting Size in Points
In this example we are setting the line width in points for the line plot.
import matplotlib.pyplot as plt
plt.figure(figsize=(6, 4))  # 6 inches wide, 4 inches tall
plt.plot([1, 2, 3], [4, 5, 6], linewidth=3.5)  # Line width in points
plt.xlabel('X-axis', fontsize=12)  # Text size in points
plt.ylabel('Y-axis', fontsize=12)
plt.show()
Output
Following is the output of the above code −
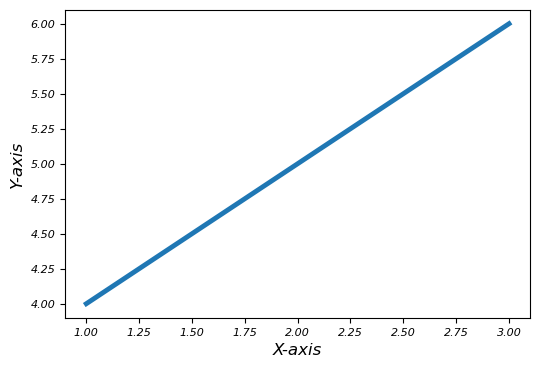
Example - Setting Size in Inches
Inches are used to specify the overall size of a figure or subplots in Matplotlib. For example figsize = (width, height) in inches defines the width and height of a figure.
In this example we are specifying the size of figure in inches.
import matplotlib.pyplot as plt
plt.figure(figsize=(4, 4))  # 6 inches wide, 4 inches tall
plt.plot([1, 2, 3], [4, 5, 6])
plt.xlabel('X-axis')
plt.ylabel('Y-axis')
plt.title('Example Plot with 4x4 Inches')
plt.show()
Output
Following is the output of the above code −

Conversion
The conversion factor between inches and other units commonly used in Matplotlib:
1 inch 2.54 centimeters
Data Units
Data units represent the actual values plotted along the x-axes and y-axes. Matplotlib uses these units to plot data points on the graph. The conversion from data units to physical units on the plot is determined by the axis scales such as linear, logarithmic etc.
Key Points about Data Units in Matplotlib
Numerical Data − Data units represent the numeric values that we plot along the x-axis and y-axis.
Mapping to Plot Space − Matplotlib maps these numerical data values to specific positions within the plot space based on the defined axis limits and scaling.
Plotting Data − When we plot data using Matplotlib then we have to specify the x and y coordinates using numerical data. Matplotlib takes care of scaling and positioning these data points within the plot.
Axis Limits − The limits set on the x-axis using xlim and y-axis using ylim define the range of data units displayed in the plot.
Axis Ticks − The tick marks on the axes represent specific data units providing a visual reference for the data range present in the plot.
Example - Setting Data Units
In this example we are setting the data units of a plot.
import matplotlib.pyplot as plt

# Sample data
x = [1, 2, 3, 4, 5]
y = [2, 4, 6, 8, 10]

# Plotting using data units
plt.plot(x, y, marker='o')

# Setting axis limits in data units
plt.xlim(0, 6)  # X-axis limits from 0 to 6
plt.ylim(0, 12)  # Y-axis limits from 0 to 12
plt.xlabel('X-axis (Data Units)')
plt.ylabel('Y-axis (Data Units)')
plt.title('Plot with Data Units')
plt.show()
Output
Following is the output of the above code −
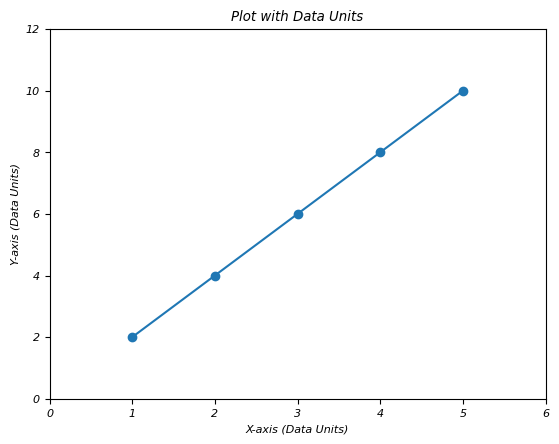
Understanding data units in Matplotlib is essential for accurately visualizing data and ensuring that the plotted representation corresponds correctly to the underlying numerical values.
Axes Coordinates
Axes coordinates range from 0.0 to 1.0 and specify the relative position within an individual subplot or axis. (0, 0) represents the bottom-left corner and (1, 1) represents the top-right corner of the subplot.
Axes coordinates offer a flexible way to position annotations, text, or other elements within a subplot relative to its size and boundaries, ensuring consistent and responsive positioning across different plot sizes or dimensions.
Example - Setting Axes Coordinates
Here n this example we are setting the axes coordinates x and y of a plot.
import matplotlib.pyplot as plt

# Creating a subplot
fig, ax = plt.subplots()

# Plotting data
ax.plot([1, 2, 3], [2, 4, 3])

# Annotating at axes coordinates
ax.annotate('Important Point',
   xy=(2, 4),               # Data point to annotate
   xytext=(0.5, 0.5),       # Position in axes coordinates
   textcoords='axes fraction',  # Specifying axes coordinates
   arrowprops=dict(facecolor='black', arrowstyle='->'))
plt.show()
Output
Following is the output of the above code −
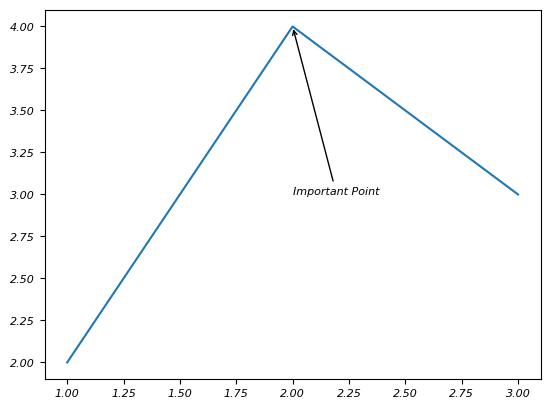
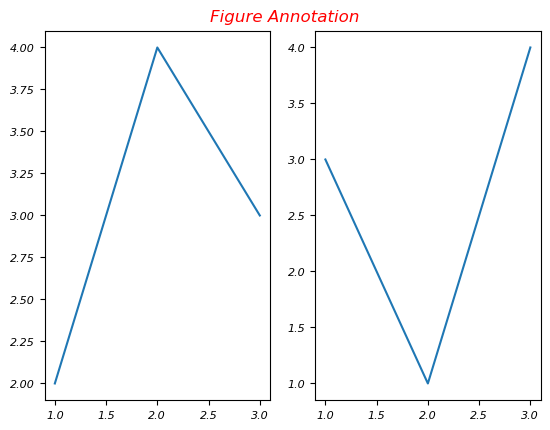
Figure Coordinates
Figure coordinates also range from 0.0 to 1.0 but specify positions relative to the entire figure canvas. (0, 0) is the bottom-left corner and (1, 1) is the top-right corner of the entire figure.
Example - Setting Figure Coordinates
This is an example of setting the figure coordinates of a plot.
import matplotlib.pyplot as plt

# Creating subplots
fig, (ax1, ax2) = plt.subplots(1, 2)

# Plotting data in subplot 1
ax1.plot([1, 2, 3], [2, 4, 3])

# Plotting data in subplot 2
ax2.plot([1, 2, 3], [3, 1, 4])

# Annotating at figure coordinates
fig.text(0.5, 0.9, 'Figure Annotation', ha='center', fontsize=12, color='red')
plt.show()
Output
Following is the output of the above code −
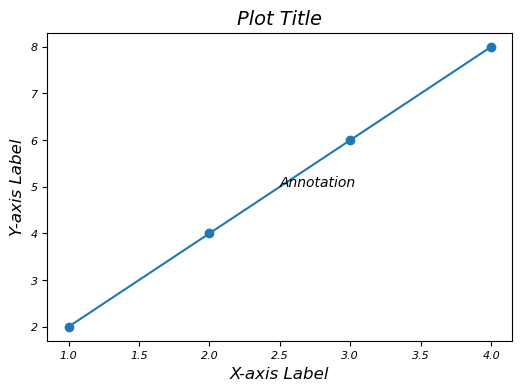
Plot with Matplolib all basic units
This example showcases the usage of various units in Matplotlib such as inches for figure size, points for text sizes, data units for plotting data points and axes coordinates for positioning annotations within a subplot.
Example - Using Various Basic Units
import matplotlib.pyplot as plt

# Define a figure with specified size in inches
fig = plt.figure(figsize=(6, 4))  # Width: 6 inches, Height: 4 inches

# Create an axis within the figure
ax = fig.add_subplot(111)

# Plotting data points using data units
x = [1, 2, 3, 4]
y = [2, 4, 6, 8]
ax.plot(x, y, marker='o')

# Setting labels and titles using text in points
ax.set_xlabel('X-axis Label', fontsize=12)
ax.set_ylabel('Y-axis Label', fontsize=12)
ax.set_title('Plot Title', fontsize=14)

# Setting the position of a text annotation using axes coordinates
ax.text(0.5, 0.5, 'Annotation', transform=ax.transAxes, fontsize=10)
plt.show()
Output
Following is the output of the above code −