- Matplotlib - Home
- Matplotlib - Introduction
- Matplotlib - Vs Seaborn
- Matplotlib - Environment Setup
- Matplotlib - Anaconda distribution
- Matplotlib - Jupyter Notebook
- Matplotlib - Pyplot API
- Matplotlib - Simple Plot
- Matplotlib - Saving Figures
- Matplotlib - Markers
- Matplotlib - Figures
- Matplotlib - Styles
- Matplotlib - Legends
- Matplotlib - Colors
- Matplotlib - Colormaps
- Matplotlib - Colormap Normalization
- Matplotlib - Choosing Colormaps
- Matplotlib - Colorbars
- Matplotlib - Working With Text
- Matplotlib - Text properties
- Matplotlib - Subplot Titles
- Matplotlib - Images
- Matplotlib - Image Masking
- Matplotlib - Annotations
- Matplotlib - Arrows
- Matplotlib - Fonts
- Matplotlib - Font Indexing
- Matplotlib - Font Properties
- Matplotlib - Scales
- Matplotlib - LaTeX
- Matplotlib - LaTeX Text Formatting in Annotations
- Matplotlib - PostScript
- Matplotlib - Mathematical Expressions
- Matplotlib - Animations
- Matplotlib - Celluloid Library
- Matplotlib - Blitting
- Matplotlib - Toolkits
- Matplotlib - Artists
- Matplotlib - Styling with Cycler
- Matplotlib - Paths
- Matplotlib - Path Effects
- Matplotlib - Transforms
- Matplotlib - Ticks and Tick Labels
- Matplotlib - Radian Ticks
- Matplotlib - Dateticks
- Matplotlib - Tick Formatters
- Matplotlib - Tick Locators
- Matplotlib - Basic Units
- Matplotlib - Autoscaling
- Matplotlib - Reverse Axes
- Matplotlib - Logarithmic Axes
- Matplotlib - Symlog
- Matplotlib - Unit Handling
- Matplotlib - Ellipse with Units
- Matplotlib - Spines
- Matplotlib - Axis Ranges
- Matplotlib - Axis Scales
- Matplotlib - Axis Ticks
- Matplotlib - Formatting Axes
- Matplotlib - Axes Class
- Matplotlib - Twin Axes
- Matplotlib - Figure Class
- Matplotlib - Multiplots
- Matplotlib - Grids
- Matplotlib - Object-oriented Interface
- Matplotlib - PyLab module
- Matplotlib - Subplots() Function
- Matplotlib - Subplot2grid() Function
- Matplotlib - Anchored Artists
- Matplotlib - Manual Contour
- Matplotlib - Coords Report
- Matplotlib - AGG filter
- Matplotlib - Ribbon Box
- Matplotlib - Fill Spiral
- Matplotlib - Findobj Method
- Matplotlib - Hyperlinks
- Matplotlib - Image Thumbnail
- Matplotlib - Plotting with Keywords
- Matplotlib - Create Logo
- Matplotlib - Multipage PDF
- Matplotlib - Multiprocessing
- Matplotlib - Print Stdout
- Matplotlib - Compound Path
- Matplotlib - Sankey Class
- Matplotlib - MRI with EEG
- Matplotlib - Stylesheets
- Matplotlib - Background Colors
- Matplotlib - Basemap
Matplotlib Events
- Matplotlib - Event Handling
- Matplotlib - Close Event
- Matplotlib - Mouse Move
- Matplotlib - Click Events
- Matplotlib - Scroll Event
- Matplotlib - Keypress Event
- Matplotlib - Pick Event
- Matplotlib - Looking Glass
- Matplotlib - Path Editor
- Matplotlib - Poly Editor
- Matplotlib - Timers
- Matplotlib - Viewlims
- Matplotlib - Zoom Window
Matplotlib Widgets
- Matplotlib - Cursor Widget
- Matplotlib - Annotated Cursor
- Matplotlib - Button Widget
- Matplotlib - Check Buttons
- Matplotlib - Lasso Selector
- Matplotlib - Menu Widget
- Matplotlib - Mouse Cursor
- Matplotlib - Multicursor
- Matplotlib - Polygon Selector
- Matplotlib - Radio Buttons
- Matplotlib - RangeSlider
- Matplotlib - Rectangle Selector
- Matplotlib - Ellipse Selector
- Matplotlib - Slider Widget
- Matplotlib - Span Selector
- Matplotlib - Textbox
Matplotlib Plotting
- Matplotlib - Line Plots
- Matplotlib - Area Plots
- Matplotlib - Bar Graphs
- Matplotlib - Histogram
- Matplotlib - Pie Chart
- Matplotlib - Scatter Plot
- Matplotlib - Box Plot
- Matplotlib - Arrow Demo
- Matplotlib - Fancy Boxes
- Matplotlib - Zorder Demo
- Matplotlib - Hatch Demo
- Matplotlib - Mmh Donuts
- Matplotlib - Ellipse Demo
- Matplotlib - Bezier Curve
- Matplotlib - Bubble Plots
- Matplotlib - Stacked Plots
- Matplotlib - Table Charts
- Matplotlib - Polar Charts
- Matplotlib - Hexagonal bin Plots
- Matplotlib - Violin Plot
- Matplotlib - Event Plot
- Matplotlib - Heatmap
- Matplotlib - Stairs Plots
- Matplotlib - Errorbar
- Matplotlib - Hinton Diagram
- Matplotlib - Contour Plot
- Matplotlib - Wireframe Plots
- Matplotlib - Surface Plots
- Matplotlib - Triangulations
- Matplotlib - Stream plot
- Matplotlib - Ishikawa Diagram
- Matplotlib - 3D Plotting
- Matplotlib - 3D Lines
- Matplotlib - 3D Scatter Plots
- Matplotlib - 3D Contour Plot
- Matplotlib - 3D Bar Plots
- Matplotlib - 3D Wireframe Plot
- Matplotlib - 3D Surface Plot
- Matplotlib - 3D Vignettes
- Matplotlib - 3D Volumes
- Matplotlib - 3D Voxels
- Matplotlib - Time Plots and Signals
- Matplotlib - Filled Plots
- Matplotlib - Step Plots
- Matplotlib - XKCD Style
- Matplotlib - Quiver Plot
- Matplotlib - Stem Plots
- Matplotlib - Visualizing Vectors
- Matplotlib - Audio Visualization
- Matplotlib - Audio Processing
Matplotlib Useful Resources
Matplotlib - Scroll Event
In general, a scroll event occurs when a user interacts with the mouse scroll wheel. The scroll wheel that is located in the middle of the mouse is used to scroll up and down on any page without using the vertical scroll bar on the right hand side of a document or webpage. In this tutorial, we will explore about the scroll event handling in Matplotlib.
Scroll event in Matplotlib
Matplotlib provides a mechanism for handling the scroll events through MouseEvent class. This scroll_event event is triggered when a user rolled the mouse scroll wheel. Which is used for providing a mechanism for interactive navigation or zooming within plots.
Example - Handing Scroll Event
Here is a simple example that detects scroll events and displays the messages based on whether the user scrolls up or down the mouse scroll wheel.
import matplotlib.pyplot as plt
import numpy as np

def on_scroll(event):
   if event.button == 'up':
      print('Scroll Up Event Triggered..')
   elif event.button == 'down':
      print('Scroll Down Event Triggered..')

# Create a figure and axis
fig, ax = plt.subplots()
ax.text(0.13, 0.5, 'Scroll Mouse Wheel on me!', dict(size=20))

# Connect the on_scroll method to the scroll_event
fig.canvas.mpl_connect('scroll_event', on_scroll)

plt.show()
Output
On executing the above code we will get the following output −
Scroll Up Event Triggered..
Scroll Up Event Triggered..
Scroll Down Event Triggered..
Scroll Up Event Triggered..
Scroll Down Event Triggered..
Scroll Up Event Triggered..
Scroll Up Event Triggered..
Watch the video below to observe how the this scroll event feature works here.
Zooming with Scroll Event
Scroll events in Matplotlib can be used for dynamically zooming the plots. By connecting the scroll event to a callable function, users can dynamically adjust the view within a plot.
Example - Zooming Plot on Scroll
Let's see an example that demonestrates how to implement zoom functionality using the scroll event.
import matplotlib.pyplot as plt

def zoom_factory(axs, base_scale=2.):
   def zoom_fun(event):
      # get the current x and y limits
      cur_xlim = axs.get_xlim()
      cur_ylim = axs.get_ylim()
      cur_xrange = (cur_xlim[1] - cur_xlim[0]) * 0.2
      cur_yrange = (cur_ylim[1] - cur_ylim[0]) * 0.2

      # get event x location
      xdata = event.xdata
      ydata = event.ydata

      if event.button == 'up':
         # deal with zoom in
         scale_factor = 1/base_scale
      elif event.button == 'down':
         # deal with zoom out
         scale_factor = base_scale
      else:
         # deal with something that should never happen
         scale_factor = 1
         print(event.button)

      # set new limits
      axs.set_xlim([xdata - cur_xrange*scale_factor,
         xdata + cur_xrange*scale_factor])
      axs.set_ylim([ydata - cur_yrange*scale_factor,
         ydata + cur_yrange*scale_factor])

      # force re-draw
      plt.draw()

   # get the figure of interest
   fig = axs.get_figure()

   # Connect the call back function to the scroll_event
   fig.canvas.mpl_connect('scroll_event', zoom_fun)

   # return the function
   return zoom_fun

# Example Usage
fig, axs = plt.subplots(figsize=(7, 4))
axs.plot(range(100))
scale = 1.5
f = zoom_factory(axs, base_scale=scale)
plt.show()
Output
On executing the above program you will get the following figure roll the mouse scroll wheel to observe the Zooming effect in this plot −
Watch the video below to observe how the this scroll event feature works here.
Interactive Scrolling through Images
The scroll event in Matplotlib can also be applied to interactively scroll through a series of images. This feature is particularly useful when navigating through multi-dimensional datasets or a collection of images.
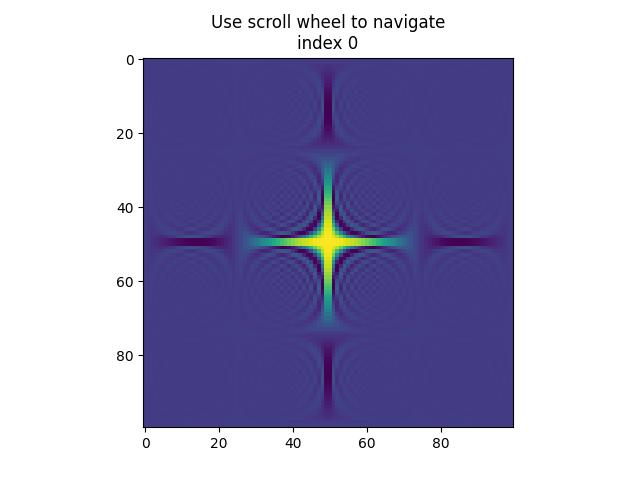
Example - Updating Image on Scroll
This example, creates a class IndexTracker to navigate through a series of 2D slices using the scroll event. The on_scroll method adjusts the index based on the scroll direction, then it updates and displayed image.
import matplotlib.pyplot as plt
import numpy as np

class IndexTracker:
   def __init__(self, axs, X):
      self.index = 0
      self.X = X
      self.axs = axs
      self.im = axs.imshow(self.X[:, :, self.index])
      self.update()

   def on_scrolling(self, event):
      print(event.button, event.step)
      increment = 1 if event.button == 'up' else -1
      maxs_index = self.X.shape[-1] - 1
      self.index = np.clip(self.index + increment, 0, maxs_index)
      self.update()

   def update(self):
      self.im.set_data(self.X[:, :, self.index])
      self.axs.set_title(
         f'Use scroll wheel to navigate\nindex {self.index}')
      self.im.axes.figure.canvas.draw()

# 3D data
x, y, z = np.ogrid[-25:25:100j, -25:25:100j, 1:50:100j]
X = np.sin(x * y * z) / (x * y * z)

# Create a figure
fig, axs = plt.subplots()
tracker = IndexTracker(axs, X)

fig.canvas.mpl_connect('scroll_event', tracker.on_scrolling)
plt.show()
Output
On executing the above program you will get the following figure roll the mouse scroll wheel to observe working of this example −
up 1.0
up 2.0
down -1.0
down -2.0
down -1.0
up 1.0
up 1.0
down -1.0
down -1.0
up 1.0
up 3.0
down -1.0
down -3.0
Watch the video below to observe how the this scroll event feature works here.