- Matplotlib - Home
- Matplotlib - Introduction
- Matplotlib - Vs Seaborn
- Matplotlib - Environment Setup
- Matplotlib - Anaconda distribution
- Matplotlib - Jupyter Notebook
- Matplotlib - Pyplot API
- Matplotlib - Simple Plot
- Matplotlib - Saving Figures
- Matplotlib - Markers
- Matplotlib - Figures
- Matplotlib - Styles
- Matplotlib - Legends
- Matplotlib - Colors
- Matplotlib - Colormaps
- Matplotlib - Colormap Normalization
- Matplotlib - Choosing Colormaps
- Matplotlib - Colorbars
- Matplotlib - Working With Text
- Matplotlib - Text properties
- Matplotlib - Subplot Titles
- Matplotlib - Images
- Matplotlib - Image Masking
- Matplotlib - Annotations
- Matplotlib - Arrows
- Matplotlib - Fonts
- Matplotlib - Font Indexing
- Matplotlib - Font Properties
- Matplotlib - Scales
- Matplotlib - LaTeX
- Matplotlib - LaTeX Text Formatting in Annotations
- Matplotlib - PostScript
- Matplotlib - Mathematical Expressions
- Matplotlib - Animations
- Matplotlib - Celluloid Library
- Matplotlib - Blitting
- Matplotlib - Toolkits
- Matplotlib - Artists
- Matplotlib - Styling with Cycler
- Matplotlib - Paths
- Matplotlib - Path Effects
- Matplotlib - Transforms
- Matplotlib - Ticks and Tick Labels
- Matplotlib - Radian Ticks
- Matplotlib - Dateticks
- Matplotlib - Tick Formatters
- Matplotlib - Tick Locators
- Matplotlib - Basic Units
- Matplotlib - Autoscaling
- Matplotlib - Reverse Axes
- Matplotlib - Logarithmic Axes
- Matplotlib - Symlog
- Matplotlib - Unit Handling
- Matplotlib - Ellipse with Units
- Matplotlib - Spines
- Matplotlib - Axis Ranges
- Matplotlib - Axis Scales
- Matplotlib - Axis Ticks
- Matplotlib - Formatting Axes
- Matplotlib - Axes Class
- Matplotlib - Twin Axes
- Matplotlib - Figure Class
- Matplotlib - Multiplots
- Matplotlib - Grids
- Matplotlib - Object-oriented Interface
- Matplotlib - PyLab module
- Matplotlib - Subplots() Function
- Matplotlib - Subplot2grid() Function
- Matplotlib - Anchored Artists
- Matplotlib - Manual Contour
- Matplotlib - Coords Report
- Matplotlib - AGG filter
- Matplotlib - Ribbon Box
- Matplotlib - Fill Spiral
- Matplotlib - Findobj Method
- Matplotlib - Hyperlinks
- Matplotlib - Image Thumbnail
- Matplotlib - Plotting with Keywords
- Matplotlib - Create Logo
- Matplotlib - Multipage PDF
- Matplotlib - Multiprocessing
- Matplotlib - Print Stdout
- Matplotlib - Compound Path
- Matplotlib - Sankey Class
- Matplotlib - MRI with EEG
- Matplotlib - Stylesheets
- Matplotlib - Background Colors
- Matplotlib - Basemap
Matplotlib Events
- Matplotlib - Event Handling
- Matplotlib - Close Event
- Matplotlib - Mouse Move
- Matplotlib - Click Events
- Matplotlib - Scroll Event
- Matplotlib - Keypress Event
- Matplotlib - Pick Event
- Matplotlib - Looking Glass
- Matplotlib - Path Editor
- Matplotlib - Poly Editor
- Matplotlib - Timers
- Matplotlib - Viewlims
- Matplotlib - Zoom Window
Matplotlib Widgets
- Matplotlib - Cursor Widget
- Matplotlib - Annotated Cursor
- Matplotlib - Button Widget
- Matplotlib - Check Buttons
- Matplotlib - Lasso Selector
- Matplotlib - Menu Widget
- Matplotlib - Mouse Cursor
- Matplotlib - Multicursor
- Matplotlib - Polygon Selector
- Matplotlib - Radio Buttons
- Matplotlib - RangeSlider
- Matplotlib - Rectangle Selector
- Matplotlib - Ellipse Selector
- Matplotlib - Slider Widget
- Matplotlib - Span Selector
- Matplotlib - Textbox
Matplotlib Plotting
- Matplotlib - Line Plots
- Matplotlib - Area Plots
- Matplotlib - Bar Graphs
- Matplotlib - Histogram
- Matplotlib - Pie Chart
- Matplotlib - Scatter Plot
- Matplotlib - Box Plot
- Matplotlib - Arrow Demo
- Matplotlib - Fancy Boxes
- Matplotlib - Zorder Demo
- Matplotlib - Hatch Demo
- Matplotlib - Mmh Donuts
- Matplotlib - Ellipse Demo
- Matplotlib - Bezier Curve
- Matplotlib - Bubble Plots
- Matplotlib - Stacked Plots
- Matplotlib - Table Charts
- Matplotlib - Polar Charts
- Matplotlib - Hexagonal bin Plots
- Matplotlib - Violin Plot
- Matplotlib - Event Plot
- Matplotlib - Heatmap
- Matplotlib - Stairs Plots
- Matplotlib - Errorbar
- Matplotlib - Hinton Diagram
- Matplotlib - Contour Plot
- Matplotlib - Wireframe Plots
- Matplotlib - Surface Plots
- Matplotlib - Triangulations
- Matplotlib - Stream plot
- Matplotlib - Ishikawa Diagram
- Matplotlib - 3D Plotting
- Matplotlib - 3D Lines
- Matplotlib - 3D Scatter Plots
- Matplotlib - 3D Contour Plot
- Matplotlib - 3D Bar Plots
- Matplotlib - 3D Wireframe Plot
- Matplotlib - 3D Surface Plot
- Matplotlib - 3D Vignettes
- Matplotlib - 3D Volumes
- Matplotlib - 3D Voxels
- Matplotlib - Time Plots and Signals
- Matplotlib - Filled Plots
- Matplotlib - Step Plots
- Matplotlib - XKCD Style
- Matplotlib - Quiver Plot
- Matplotlib - Stem Plots
- Matplotlib - Visualizing Vectors
- Matplotlib - Audio Visualization
- Matplotlib - Audio Processing
Matplotlib Useful Resources
Matplotlib - Symlog
What is Symlog?
symlog is a scale in Matplotlib that combines both linear and logarithmic scaling by providing a way to plot data that includes both positive and negative values while accommodating a wide range of magnitudes.
Characteristics of Symlog Scale
The below are the characteristics of Symlog scale. Lets go through one by one in detail.
Linear Near Zero
In the context of the symlog scale in Matplotlib library linear near zero refers to the behavior of the scale around the zero point. The symlog scale combines linear and logarithmic scaling particularly in the vicinity of zero to allow for a more nuanced representation of data.
Linear Behavior Near Zero
Close to Zero − For values close to zero i.e. within a defined range around zero the symlog scale behaves linearly and similar to a linear scale.
Linear Threshold (linthresh) − The linthresh parameter defines the range around zero where the scale behaves linearly. Values within this threshold are represented linearly.
Linear Region − Within the specified threshold around zero the symlog scale behaves like a typical linear scale preserving the direct relationship between data values and their representation on the plot.
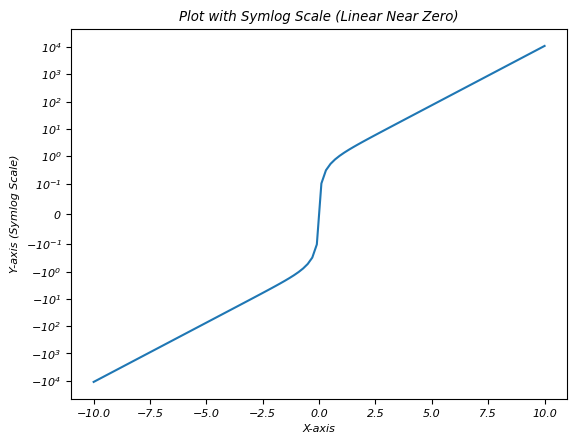
Example - Linear Near Zero
In this example we are setting the linthresh parameter as 0.1 to range around zero (-0.1 to 0.1 in this case) behaves linearly. Values within this range are represented linearly on the plot by allowing for a more focused and precise visualization of data close to zero while accommodating larger values away from zero logarithmically.
import matplotlib.pyplot as plt
import numpy as np
# Sample data with positive and negative values
x = np.linspace(-10, 10, 100)
y = np.sinh(x)  # Hyperbolic sine function for demonstration
# Creating a plot with symlog scale on y-axis
plt.plot(x, y)
plt.yscale('symlog', linthresh=0.1)  # Set y-axis to symlog scale with a linear threshold of 0.1
plt.xlabel('X-axis')
plt.ylabel('Y-axis (Symlog Scale)')
plt.title('Plot with Symlog Scale (Linear Near Zero)')
plt.show()
Output
The use cases of Linear near zero
Focus on Small Changes near Zero − Allows better representation of small changes or variations near zero without losing information about larger values.
Handling Data with Zero-Centered Patterns − Useful for datasets where patterns or changes are centered around zero.
Symmetric logarithmic scaling
Symmetric logarithmic scaling is often referred to as symlog scaling in Matplotlib which is a scaling method that combines both linear and logarithmic scales to represent data symmetrically around zero. This scale is particularly useful when dealing with datasets that contain values spanning positive and negative ranges and require a nuanced representation across a wide range of values.
Characteristics of Symlog Scaling
Symmetric Behavior − Symlog scaling maintains symmetry around zero,accommodating both positive and negative values.
Linear Region Near Zero − Close to zero within a defined range around zero the scale behaves linearly by preserving the direct proportionality of values and their representation on the plot.
Logarithmic Scaling Away from Zero − As values move away from zero i.e. both positive and negative the scale transitions into a logarithmic scale allowing representation of larger absolute values logarithmically.
Linear Threshold (linthresh) − The linthresh parameter defines the range around zero where the scale behaves linearly.
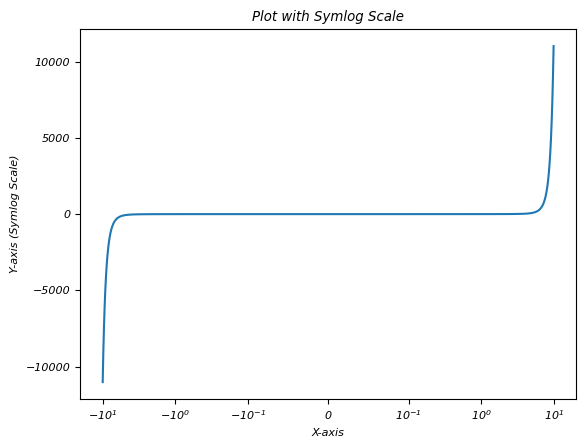
Example - Symmetric logarithmic scaling
In this example the symlog scale with a linthresh of 0.1 specifies that values within the range of -0.1 to 0.1 (around zero) are represented linearly on the x-axis.
import matplotlib.pyplot as plt
import numpy as np
# Sample data with positive and negative values
x = np.linspace(-10, 10, 100)
y = np.sinh(x)  # Hyperbolic sine function for demonstration
# Creating a plot with symlog scale on y-axis
plt.plot(x, y)
plt.xscale('symlog', linthresh=0.1)  # Set x-axis to symlog scale with a linear threshold of 0.1
plt.xlabel('X-axis')
plt.ylabel('Y-axis (Symlog Scale)')
plt.title('Plot with Symlog Scale')
plt.show()
Output
Use Cases
Handling Data with Both Positive and Negative Values − Useful for datasets spanning positive and negative ranges.
Focused Visualization − This allows to focus on small changes near zero while accommodating larger values away from zero logarithmically.
Logarithmic away from zero
Logarithmic away from zero refers to the behavior of a logarithmic scale in a plot particularly in the context of the symlog scale in Matplotlib.
The below are the characteristics of the Logarithmic away from zero.
Near Zero − Close to zero within a specified range around zero which is defined by the linthresh parameter. The scale behaves linearly by preserving a direct relationship between the plotted values and their representation on the plot.
Away from Zero − As the values move further away from zero both positively and negatively the scale transitions into a logarithmic scaling behavior.
Logarithmic Behavior − The scale represents larger absolute values logarithmically using powers of a base value i.e. usually 10 or e to visually compress the range of these larger values.
Compression of Values − Larger absolute values away from zero are compressed on the plot due to the logarithmic scaling making it easier to visualize a wide range of values efficiently.
Example - Logarithmic away from zero
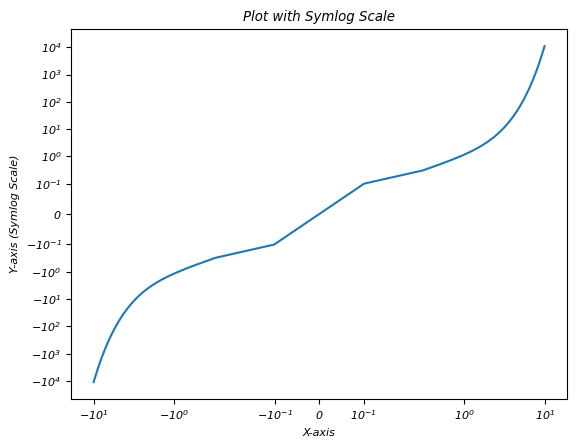
In this example we are setting the linthresh parameters as 0.2 and 0.1 for xscale and yscale repectively.
import matplotlib.pyplot as plt
import numpy as np
# Sample data with positive and negative values
x = np.linspace(-10, 10, 100)
y = np.sinh(x)  # Hyperbolic sine function for demonstration
# Creating a plot with symlog scale on y-axis
plt.plot(x, y)
plt.xscale('symlog', linthresh=0.2)  # Set x-axis to symlog scale with a linear threshold of 0.2
plt.yscale('symlog', linthresh=0.1)  # Set x-axis to symlog scale with a linear threshold of 0.1
plt.xlabel('X-axis')
plt.ylabel('Y-axis (Symlog Scale)')
plt.title('Plot with Symlog Scale')
plt.show()
Output