- Matplotlib - Home
- Matplotlib - Introduction
- Matplotlib - Vs Seaborn
- Matplotlib - Environment Setup
- Matplotlib - Anaconda distribution
- Matplotlib - Jupyter Notebook
- Matplotlib - Pyplot API
- Matplotlib - Simple Plot
- Matplotlib - Saving Figures
- Matplotlib - Markers
- Matplotlib - Figures
- Matplotlib - Styles
- Matplotlib - Legends
- Matplotlib - Colors
- Matplotlib - Colormaps
- Matplotlib - Colormap Normalization
- Matplotlib - Choosing Colormaps
- Matplotlib - Colorbars
- Matplotlib - Working With Text
- Matplotlib - Text properties
- Matplotlib - Subplot Titles
- Matplotlib - Images
- Matplotlib - Image Masking
- Matplotlib - Annotations
- Matplotlib - Arrows
- Matplotlib - Fonts
- Matplotlib - Font Indexing
- Matplotlib - Font Properties
- Matplotlib - Scales
- Matplotlib - LaTeX
- Matplotlib - LaTeX Text Formatting in Annotations
- Matplotlib - PostScript
- Matplotlib - Mathematical Expressions
- Matplotlib - Animations
- Matplotlib - Celluloid Library
- Matplotlib - Blitting
- Matplotlib - Toolkits
- Matplotlib - Artists
- Matplotlib - Styling with Cycler
- Matplotlib - Paths
- Matplotlib - Path Effects
- Matplotlib - Transforms
- Matplotlib - Ticks and Tick Labels
- Matplotlib - Radian Ticks
- Matplotlib - Dateticks
- Matplotlib - Tick Formatters
- Matplotlib - Tick Locators
- Matplotlib - Basic Units
- Matplotlib - Autoscaling
- Matplotlib - Reverse Axes
- Matplotlib - Logarithmic Axes
- Matplotlib - Symlog
- Matplotlib - Unit Handling
- Matplotlib - Ellipse with Units
- Matplotlib - Spines
- Matplotlib - Axis Ranges
- Matplotlib - Axis Scales
- Matplotlib - Axis Ticks
- Matplotlib - Formatting Axes
- Matplotlib - Axes Class
- Matplotlib - Twin Axes
- Matplotlib - Figure Class
- Matplotlib - Multiplots
- Matplotlib - Grids
- Matplotlib - Object-oriented Interface
- Matplotlib - PyLab module
- Matplotlib - Subplots() Function
- Matplotlib - Subplot2grid() Function
- Matplotlib - Anchored Artists
- Matplotlib - Manual Contour
- Matplotlib - Coords Report
- Matplotlib - AGG filter
- Matplotlib - Ribbon Box
- Matplotlib - Fill Spiral
- Matplotlib - Findobj Method
- Matplotlib - Hyperlinks
- Matplotlib - Image Thumbnail
- Matplotlib - Plotting with Keywords
- Matplotlib - Create Logo
- Matplotlib - Multipage PDF
- Matplotlib - Multiprocessing
- Matplotlib - Print Stdout
- Matplotlib - Compound Path
- Matplotlib - Sankey Class
- Matplotlib - MRI with EEG
- Matplotlib - Stylesheets
- Matplotlib - Background Colors
- Matplotlib - Basemap
Matplotlib Events
- Matplotlib - Event Handling
- Matplotlib - Close Event
- Matplotlib - Mouse Move
- Matplotlib - Click Events
- Matplotlib - Scroll Event
- Matplotlib - Keypress Event
- Matplotlib - Pick Event
- Matplotlib - Looking Glass
- Matplotlib - Path Editor
- Matplotlib - Poly Editor
- Matplotlib - Timers
- Matplotlib - Viewlims
- Matplotlib - Zoom Window
Matplotlib Widgets
- Matplotlib - Cursor Widget
- Matplotlib - Annotated Cursor
- Matplotlib - Button Widget
- Matplotlib - Check Buttons
- Matplotlib - Lasso Selector
- Matplotlib - Menu Widget
- Matplotlib - Mouse Cursor
- Matplotlib - Multicursor
- Matplotlib - Polygon Selector
- Matplotlib - Radio Buttons
- Matplotlib - RangeSlider
- Matplotlib - Rectangle Selector
- Matplotlib - Ellipse Selector
- Matplotlib - Slider Widget
- Matplotlib - Span Selector
- Matplotlib - Textbox
Matplotlib Plotting
- Matplotlib - Line Plots
- Matplotlib - Area Plots
- Matplotlib - Bar Graphs
- Matplotlib - Histogram
- Matplotlib - Pie Chart
- Matplotlib - Scatter Plot
- Matplotlib - Box Plot
- Matplotlib - Arrow Demo
- Matplotlib - Fancy Boxes
- Matplotlib - Zorder Demo
- Matplotlib - Hatch Demo
- Matplotlib - Mmh Donuts
- Matplotlib - Ellipse Demo
- Matplotlib - Bezier Curve
- Matplotlib - Bubble Plots
- Matplotlib - Stacked Plots
- Matplotlib - Table Charts
- Matplotlib - Polar Charts
- Matplotlib - Hexagonal bin Plots
- Matplotlib - Violin Plot
- Matplotlib - Event Plot
- Matplotlib - Heatmap
- Matplotlib - Stairs Plots
- Matplotlib - Errorbar
- Matplotlib - Hinton Diagram
- Matplotlib - Contour Plot
- Matplotlib - Wireframe Plots
- Matplotlib - Surface Plots
- Matplotlib - Triangulations
- Matplotlib - Stream plot
- Matplotlib - Ishikawa Diagram
- Matplotlib - 3D Plotting
- Matplotlib - 3D Lines
- Matplotlib - 3D Scatter Plots
- Matplotlib - 3D Contour Plot
- Matplotlib - 3D Bar Plots
- Matplotlib - 3D Wireframe Plot
- Matplotlib - 3D Surface Plot
- Matplotlib - 3D Vignettes
- Matplotlib - 3D Volumes
- Matplotlib - 3D Voxels
- Matplotlib - Time Plots and Signals
- Matplotlib - Filled Plots
- Matplotlib - Step Plots
- Matplotlib - XKCD Style
- Matplotlib - Quiver Plot
- Matplotlib - Stem Plots
- Matplotlib - Visualizing Vectors
- Matplotlib - Audio Visualization
- Matplotlib - Audio Processing
Matplotlib Useful Resources
Matplotlib - Poly Editor
Poly Editor is short for Polygon Editor is an application that allows users to interactively edit and manipulate vertices of a polygon in a graphical environment.
In the context of Matplotlib, a Poly Editor typically refers to a cross-GUI application that allows users to interactively modify polygons displayed on a canvas. This application provides features such as adding, deleting, and moving vertices of a polygon, as well as adjusting its shape and position using mouse clicks and keybindings.
This tutorial will demonstrate how to create a polygon editor using Matplotlib's event handling capabilities.
Creating the Polygon Interactor Class
To create the Poly Editor, define a Python class called PolygonInteractor, which handles interactions with the polygon vertices. This class implements event handling methods to respond to user interactions −
on_draw − Handles the drawing of the polygon and its vertices.
on_button_press − Responds to mouse button presses to select vertices.
on_button_release − Handles mouse button releases.
on_key_press − Handles key presses to toggle vertex markers(using the 't' key), delete vertices(using the d key), or insert new vertices(using the 'i' key).
on_mouse_move − Handles mouse movements to drag vertices and update the polygon.
Below is the implementation of the PolygonInteractor class −
class PolygonInteractor:

   showverts = True
   epsilon = 3

   def __init__(self, ax, poly):
      if poly.figure is None:
         raise RuntimeError('You must first add the polygon to a figure '
            'or canvas before defining the interactor')
      self.ax = ax
      canvas = poly.figure.canvas
      self.poly = poly

      x, y = zip(*self.poly.xy)
      self.line = Line2D(x, y,
         marker='o', markerfacecolor='r',
         animated=True)
      self.ax.add_line(self.line)

      self.cid = self.poly.add_callback(self.poly_changed)
      self._ind = None  # the active vert

      canvas.mpl_connect('draw_event', self.on_draw)
      canvas.mpl_connect('button_press_event', self.on_button_press)
      canvas.mpl_connect('key_press_event', self.on_key_press)
      canvas.mpl_connect('button_release_event', self.on_button_release)
      canvas.mpl_connect('motion_notify_event', self.on_mouse_move)
      self.canvas = canvas

   def on_draw(self, event):
      self.background = self.canvas.copy_from_bbox(self.ax.bbox)
      self.ax.draw_artist(self.poly)
      self.ax.draw_artist(self.line)


   def poly_changed(self, poly):
      vis = self.line.get_visible()
      Artist.update_from(self.line, poly)
      self.line.set_visible(vis)  # don't use the poly visibility state

   def get_ind_under_point(self, event):
      xy = np.asarray(self.poly.xy)
      xyt = self.poly.get_transform().transform(xy)
      xt, yt = xyt[:, 0], xyt[:, 1]
      d = np.hypot(xt - event.x, yt - event.y)
      indseq, = np.nonzero(d == d.min())
      ind = indseq[0]

      if d[ind] >= self.epsilon:
         ind = None

         return ind

   def on_button_press(self, event):

      if not self.showverts:
         return
      if event.inaxes is None:
         return
      if event.button != 1:
         return
      self._ind = self.get_ind_under_point(event)

   def on_button_release(self, event):

      if not self.showverts:
         return
      if event.button != 1:
         return
      self._ind = None

   def on_key_press(self, event):

      if not event.inaxes:
         return
      if event.key == 't':
            self.showverts = not self.showverts
            self.line.set_visible(self.showverts)
            if not self.showverts:
               self._ind = None
      elif event.key == 'd':
         ind = self.get_ind_under_point(event)
         if ind is not None:
            self.poly.xy = np.delete(self.poly.xy,
               ind, axis=0)
            self.line.set_data(zip(*self.poly.xy))
      elif event.key == 'i':
         xys = self.poly.get_transform().transform(self.poly.xy)
         p = event.x, event.y  # display coords
         for i in range(len(xys) - 1):
            s0 = xys[i]
            s1 = xys[i + 1]
            d = dist_point_to_segment(p, s0, s1)
            if d <= self.epsilon:
               self.poly.xy = np.insert(
                  self.poly.xy, i+1,
                  [event.xdata, event.ydata],
                  axis=0)
               self.line.set_data(zip(*self.poly.xy))
               break
      if self.line.stale:
         self.canvas.draw_idle()

   def on_mouse_move(self, event):
      if not self.showverts:
         return
      if self._ind is None:
         return
      if event.inaxes is None:
         return
      if event.button != 1:
         return
      x, y = event.xdata, event.ydata

      self.poly.xy[self._ind] = x, y
      if self._ind == 0:
         self.poly.xy[-1] = x, y
      elif self._ind == len(self.poly.xy) - 1:
         self.poly.xy[0] = x, y
      self.line.set_data(zip(*self.poly.xy))

      self.canvas.restore_region(self.background)
      self.ax.draw_artist(self.poly)
      self.ax.draw_artist(self.line)
      self.canvas.blit(self.ax.bbox)
Defining Utility Function
Define a utility function dist_point_to_segment to calculate the distance between a point and a line segment. This function is used to determine which vertex is closest to the mouse cursor during interaction.
def dist_point_to_segment(p, s0, s1):
   s01 = s1 - s0
   s0p = p - s0
   if (s01 == 0).all():
      return np.hypot(*s0p)

   p1 = s0 + np.clip((s0p @ s01) / (s01 @ s01), 0, 1) * s01
   return np.hypot(*(p - p1))
Initializing the Polygon Editor
To initialize the polygon editor, we need to create an instance of the PolygonInteractor class and pass it the axis object and the polygon object:
if __name__ == '__main__':
   import matplotlib.pyplot as plt

   from matplotlib.patches import Polygon

   theta = np.arange(0, 2*np.pi, 0.2)
   r = 1.5

   xs = r * np.cos(theta)
   ys = r * np.sin(theta)

   poly = Polygon(np.column_stack([xs, ys]), animated=True)

   fig, ax = plt.subplots()
   ax.add_patch(poly)
   p = PolygonInteractor(ax, poly)

   ax.set_title('Click and drag a point to move it')
   ax.set_xlim((-2, 2))
   ax.set_ylim((-2, 2))
   plt.show()
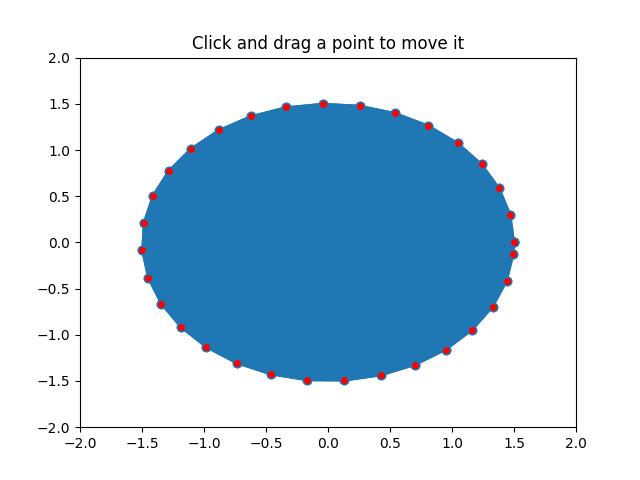
Running the Poly Editor
By executing the complete code provided below, we will get a Matplotlib window displaying a plot with a polygon. We can interact with the polygon by clicking and dragging its vertices, toggling vertex markers by pressing the t key, pressing the 'd' key to delete vertices, and pressing the 'i' key to insert new vertices.
Example - Poly Editor Application
import matplotlib.pyplot as plt
import numpy as np

from matplotlib.backend_bases import MouseButton
from matplotlib.patches import PathPatch
from matplotlib.path import Path
from matplotlib.lines import Line2D

class PolygonInteractor:

   showverts = True
   epsilon = 3

   def __init__(self, ax, poly):
      if poly.figure is None:
         raise RuntimeError('You must first add the polygon to a figure '
            'or canvas before defining the interactor')
      self.ax = ax
      canvas = poly.figure.canvas
      self.poly = poly

      x, y = zip(*self.poly.xy)
      self.line = Line2D(x, y,
         marker='o', markerfacecolor='r',
         animated=True)
      self.ax.add_line(self.line)

      self.cid = self.poly.add_callback(self.poly_changed)
      self._ind = None  # the active vert

      canvas.mpl_connect('draw_event', self.on_draw)
      canvas.mpl_connect('button_press_event', self.on_button_press)
      canvas.mpl_connect('key_press_event', self.on_key_press)
      canvas.mpl_connect('button_release_event', self.on_button_release)
      canvas.mpl_connect('motion_notify_event', self.on_mouse_move)
      self.canvas = canvas

   def on_draw(self, event):
      self.background = self.canvas.copy_from_bbox(self.ax.bbox)
      self.ax.draw_artist(self.poly)
      self.ax.draw_artist(self.line)


   def poly_changed(self, poly):
      vis = self.line.get_visible()
      Artist.update_from(self.line, poly)
      self.line.set_visible(vis)  # don't use the poly visibility state

   def get_ind_under_point(self, event):
      xy = np.asarray(self.poly.xy)
      xyt = self.poly.get_transform().transform(xy)
      xt, yt = xyt[:, 0], xyt[:, 1]
      d = np.hypot(xt - event.x, yt - event.y)
      indseq, = np.nonzero(d == d.min())
      ind = indseq[0]

      if d[ind] >= self.epsilon:
         ind = None

         return ind

   def on_button_press(self, event):

      if not self.showverts:
         return
      if event.inaxes is None:
         return
      if event.button != 1:
         return
      self._ind = self.get_ind_under_point(event)

   def on_button_release(self, event):

      if not self.showverts:
         return
      if event.button != 1:
         return
      self._ind = None

   def on_key_press(self, event):

      if not event.inaxes:
         return
      if event.key == 't':
            self.showverts = not self.showverts
            self.line.set_visible(self.showverts)
            if not self.showverts:
               self._ind = None
      elif event.key == 'd':
         ind = self.get_ind_under_point(event)
         if ind is not None:
            self.poly.xy = np.delete(self.poly.xy,
               ind, axis=0)
            self.line.set_data(zip(*self.poly.xy))
      elif event.key == 'i':
         xys = self.poly.get_transform().transform(self.poly.xy)
         p = event.x, event.y  # display coords
         for i in range(len(xys) - 1):
            s0 = xys[i]
            s1 = xys[i + 1]
            d = dist_point_to_segment(p, s0, s1)
            if d <= self.epsilon:
               self.poly.xy = np.insert(
                  self.poly.xy, i+1,
                  [event.xdata, event.ydata],
                  axis=0)
               self.line.set_data(zip(*self.poly.xy))
               break
      if self.line.stale:
         self.canvas.draw_idle()

   def on_mouse_move(self, event):
      if not self.showverts:
         return
      if self._ind is None:
         return
      if event.inaxes is None:
         return
      if event.button != 1:
         return
      x, y = event.xdata, event.ydata

      self.poly.xy[self._ind] = x, y
      if self._ind == 0:
         self.poly.xy[-1] = x, y
      elif self._ind == len(self.poly.xy) - 1:
         self.poly.xy[0] = x, y
      self.line.set_data(zip(*self.poly.xy))

      self.canvas.restore_region(self.background)
      self.ax.draw_artist(self.poly)
      self.ax.draw_artist(self.line)
      self.canvas.blit(self.ax.bbox)

def dist_point_to_segment(p, s0, s1):
   s01 = s1 - s0
   s0p = p - s0
   if (s01 == 0).all():
      return np.hypot(*s0p)

   p1 = s0 + np.clip((s0p @ s01) / (s01 @ s01), 0, 1) * s01
   return np.hypot(*(p - p1))

if __name__ == '__main__':
   import matplotlib.pyplot as plt

   from matplotlib.patches import Polygon

   theta = np.arange(0, 2*np.pi, 0.2)
   r = 1.5

   xs = r * np.cos(theta)
   ys = r * np.sin(theta)

   poly = Polygon(np.column_stack([xs, ys]), animated=True)

   fig, ax = plt.subplots()
   ax.add_patch(poly)
   p = PolygonInteractor(ax, poly)

   ax.set_title('Click and drag a point to move it')
   ax.set_xlim((-2, 2))
   ax.set_ylim((-2, 2))
   plt.show()
Output
On executing the above code we will get the following output −
Watch the video below to observe the works of this application −
