- Matplotlib - Home
- Matplotlib - Introduction
- Matplotlib - Vs Seaborn
- Matplotlib - Environment Setup
- Matplotlib - Anaconda distribution
- Matplotlib - Jupyter Notebook
- Matplotlib - Pyplot API
- Matplotlib - Simple Plot
- Matplotlib - Saving Figures
- Matplotlib - Markers
- Matplotlib - Figures
- Matplotlib - Styles
- Matplotlib - Legends
- Matplotlib - Colors
- Matplotlib - Colormaps
- Matplotlib - Colormap Normalization
- Matplotlib - Choosing Colormaps
- Matplotlib - Colorbars
- Matplotlib - Working With Text
- Matplotlib - Text properties
- Matplotlib - Subplot Titles
- Matplotlib - Images
- Matplotlib - Image Masking
- Matplotlib - Annotations
- Matplotlib - Arrows
- Matplotlib - Fonts
- Matplotlib - Font Indexing
- Matplotlib - Font Properties
- Matplotlib - Scales
- Matplotlib - LaTeX
- Matplotlib - LaTeX Text Formatting in Annotations
- Matplotlib - PostScript
- Matplotlib - Mathematical Expressions
- Matplotlib - Animations
- Matplotlib - Celluloid Library
- Matplotlib - Blitting
- Matplotlib - Toolkits
- Matplotlib - Artists
- Matplotlib - Styling with Cycler
- Matplotlib - Paths
- Matplotlib - Path Effects
- Matplotlib - Transforms
- Matplotlib - Ticks and Tick Labels
- Matplotlib - Radian Ticks
- Matplotlib - Dateticks
- Matplotlib - Tick Formatters
- Matplotlib - Tick Locators
- Matplotlib - Basic Units
- Matplotlib - Autoscaling
- Matplotlib - Reverse Axes
- Matplotlib - Logarithmic Axes
- Matplotlib - Symlog
- Matplotlib - Unit Handling
- Matplotlib - Ellipse with Units
- Matplotlib - Spines
- Matplotlib - Axis Ranges
- Matplotlib - Axis Scales
- Matplotlib - Axis Ticks
- Matplotlib - Formatting Axes
- Matplotlib - Axes Class
- Matplotlib - Twin Axes
- Matplotlib - Figure Class
- Matplotlib - Multiplots
- Matplotlib - Grids
- Matplotlib - Object-oriented Interface
- Matplotlib - PyLab module
- Matplotlib - Subplots() Function
- Matplotlib - Subplot2grid() Function
- Matplotlib - Anchored Artists
- Matplotlib - Manual Contour
- Matplotlib - Coords Report
- Matplotlib - AGG filter
- Matplotlib - Ribbon Box
- Matplotlib - Fill Spiral
- Matplotlib - Findobj Method
- Matplotlib - Hyperlinks
- Matplotlib - Image Thumbnail
- Matplotlib - Plotting with Keywords
- Matplotlib - Create Logo
- Matplotlib - Multipage PDF
- Matplotlib - Multiprocessing
- Matplotlib - Print Stdout
- Matplotlib - Compound Path
- Matplotlib - Sankey Class
- Matplotlib - MRI with EEG
- Matplotlib - Stylesheets
- Matplotlib - Background Colors
- Matplotlib - Basemap
Matplotlib Events
- Matplotlib - Event Handling
- Matplotlib - Close Event
- Matplotlib - Mouse Move
- Matplotlib - Click Events
- Matplotlib - Scroll Event
- Matplotlib - Keypress Event
- Matplotlib - Pick Event
- Matplotlib - Looking Glass
- Matplotlib - Path Editor
- Matplotlib - Poly Editor
- Matplotlib - Timers
- Matplotlib - Viewlims
- Matplotlib - Zoom Window
Matplotlib Widgets
- Matplotlib - Cursor Widget
- Matplotlib - Annotated Cursor
- Matplotlib - Button Widget
- Matplotlib - Check Buttons
- Matplotlib - Lasso Selector
- Matplotlib - Menu Widget
- Matplotlib - Mouse Cursor
- Matplotlib - Multicursor
- Matplotlib - Polygon Selector
- Matplotlib - Radio Buttons
- Matplotlib - RangeSlider
- Matplotlib - Rectangle Selector
- Matplotlib - Ellipse Selector
- Matplotlib - Slider Widget
- Matplotlib - Span Selector
- Matplotlib - Textbox
Matplotlib Plotting
- Matplotlib - Line Plots
- Matplotlib - Area Plots
- Matplotlib - Bar Graphs
- Matplotlib - Histogram
- Matplotlib - Pie Chart
- Matplotlib - Scatter Plot
- Matplotlib - Box Plot
- Matplotlib - Arrow Demo
- Matplotlib - Fancy Boxes
- Matplotlib - Zorder Demo
- Matplotlib - Hatch Demo
- Matplotlib - Mmh Donuts
- Matplotlib - Ellipse Demo
- Matplotlib - Bezier Curve
- Matplotlib - Bubble Plots
- Matplotlib - Stacked Plots
- Matplotlib - Table Charts
- Matplotlib - Polar Charts
- Matplotlib - Hexagonal bin Plots
- Matplotlib - Violin Plot
- Matplotlib - Event Plot
- Matplotlib - Heatmap
- Matplotlib - Stairs Plots
- Matplotlib - Errorbar
- Matplotlib - Hinton Diagram
- Matplotlib - Contour Plot
- Matplotlib - Wireframe Plots
- Matplotlib - Surface Plots
- Matplotlib - Triangulations
- Matplotlib - Stream plot
- Matplotlib - Ishikawa Diagram
- Matplotlib - 3D Plotting
- Matplotlib - 3D Lines
- Matplotlib - 3D Scatter Plots
- Matplotlib - 3D Contour Plot
- Matplotlib - 3D Bar Plots
- Matplotlib - 3D Wireframe Plot
- Matplotlib - 3D Surface Plot
- Matplotlib - 3D Vignettes
- Matplotlib - 3D Volumes
- Matplotlib - 3D Voxels
- Matplotlib - Time Plots and Signals
- Matplotlib - Filled Plots
- Matplotlib - Step Plots
- Matplotlib - XKCD Style
- Matplotlib - Quiver Plot
- Matplotlib - Stem Plots
- Matplotlib - Visualizing Vectors
- Matplotlib - Audio Visualization
- Matplotlib - Audio Processing
Matplotlib Useful Resources
Matplotlib - Jupyter Notebook
Jupyter is a loose acronym meaning Julia, Python, and R. These programming languages were the first target languages of the Jupyter application, but nowadays, the notebook technology also supports many other languages.
In 2001, Fernando Prez started developing Ipython. IPython is a command shell for interactive computing in multiple programming languages, originally developed for the Python.
Matplotlib in Jupyter Notebook provides an interactive environment for creating visualizations right alongside our code. Let's go through the steps to start using Matplotlib in a Jupyter Notebook.
Matplotlib library in Jupyter Notebook provides a convenient way to visualize data interactively by allowing for an exploratory and explanatory workflow when working on data analysis, machine learning or any other Python-based project.
Consider the following features provided by IPython −
Interactive shells (terminal and Qt-based).
A browser-based notebook with support for code, text, mathematical expressions, inline plots and other media.
Support for interactive data visualization and use of GUI toolkits.
Flexible, embeddable interpreters to load into one's own projects.
In 2014, Fernando Prez announced a spin-off project from IPython called Project Jupyter. IPython will continue to exist as a Python shell and a kernel for Jupyter, while the notebook and other language-agnostic parts of IPython will move under the Jupyter name. Jupyter added support for Julia, R, Haskell and Ruby.
Starting Jupyter Notebook
The below are the steps to be done by one by one to work in the Jupyter Notebook.
Launch Jupyter Notebook
Open Anaconda Navigator.
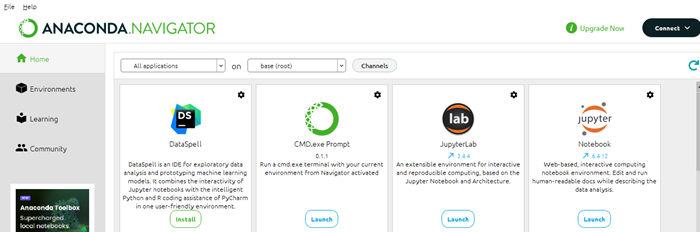
Launch Jupyter Notebook from the Navigator or in the terminal/Anaconda Prompt type jupyter notebook and hit Enter.
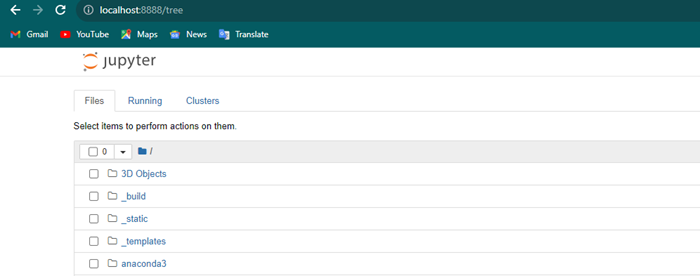
Create or Open a Notebook
Once Jupyter Notebook opens in our web browser then navigate to the directory where we want to work.
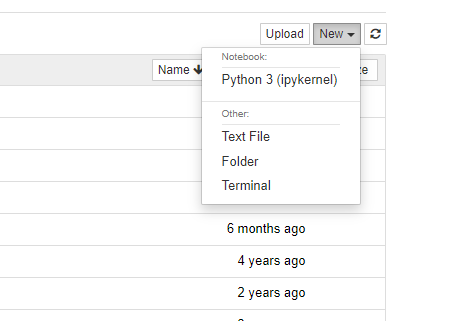
After click on "New" and choose a Python notebook which is often referred to as an "Untitled" notebook.
Import Matplotlib
In a Jupyter Notebook cell import Matplotlib library by using the lines of code.
import matplotlib.pyplot as plt
%matplotlib inline
%matplotlib inline is a magic command that tells Jupyter Notebook to display Matplotlib plots inline within the notebook.
Create Plots
We can now use Matplotlib functions to create our plots. For example lets create a line plot by using the numpy data.
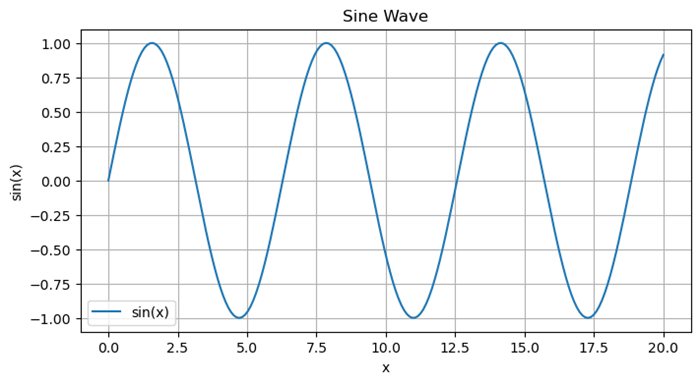
Example - Creating a Line Plot
import numpy as np
import matplotlib.pyplot as plt
# Generating sample data
x = np.linspace(0, 20, 200)
y = np.sin(x)
# Plotting the data
plt.figure(figsize=(8, 4))
plt.plot(x, y, label='sin(x)')
plt.title('Sine Wave')
plt.xlabel('x')
plt.ylabel('sin(x)')
plt.legend()
plt.grid(True)
plt.show()
Output
Interact with Plots
Once the plot is generated then it will be displayed directly in the notebook below the cell. We can interact with the plot i.e. panning, zooming can be done if we used %matplotlib notebook instead of %matplotlib inline at the import stage.
Multiple Plots
We can create multiple plots by creating new cells and running more Matplotlib commands.
Markdown Cells
We can add explanatory text in Markdown cells above or between code cells to describe our plots or analysis.
Saving Plots
We can use plt.savefig('filename.png') to save a plot as an image file within our Jupyter environment.
Closing Jupyter Notebook
Once we have finished working in the notebook we can shut it down from the Jupyter Notebook interface or close the terminal/Anaconda Prompt where Jupyter Notebook was launched.
Hide Matplotlib descriptions in Jupyter notebook
To hide matplotlib descriptions of an instance while calling plot() method, we can take the following steps
Open Ipython instance.
import numpy as np
from matplotlib, import pyplot as plt
Create points for x, i.e., np.linspace(1, 10, 1000)
Now, plot the line using plot() method.
To hide the instance, use plt.plot(x); i.e., (with semi-colon)
Or, use _ = plt.plot(x)
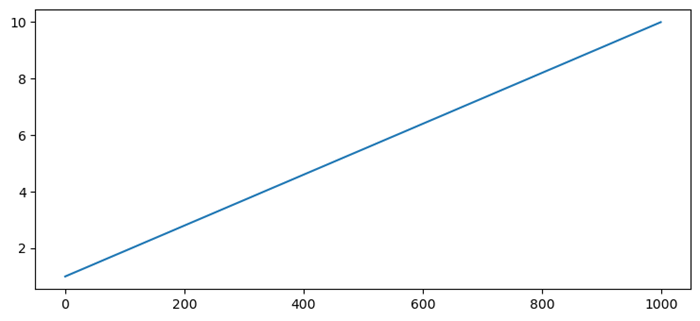
Example - Hiding Description Code
In this example we are hiding the description code.
import numpy as np
from matplotlib import pyplot as plt
x = np.linspace(1, 10, 1000)
plt.plot(x)
plt.show()
Output