- Python Pillow - Home
- Python Pillow - Overview
- Python Pillow - Environment Setup
- Basic Image Operations
- Python Pillow - Working with Images
- Python Pillow - Resizing an Image
- Python Pillow - Flip and Rotate Images
- Python Pillow - Cropping an Image
- Python Pillow - Adding Borders to Images
- Python Pillow - Identifying Image Files
- Python Pillow - Merging Images
- Python Pillow - Cutting and Pasting Images
- Python Pillow - Rolling an Image
- Python Pillow - Writing text on image
- Python Pillow - ImageDraw Module
- Python Pillow - Concatenating two Images
- Python Pillow - Creating Thumbnails
- Python Pillow - Creating a Watermark
- Python Pillow - Image Sequences
- Python Pillow Color Conversions
- Python Pillow - Colors on an Image
- Python Pillow - Creating Images With Colors
- Python Pillow - Converting Color String to RGB Color Values
- Python Pillow - Converting Color String to Grayscale Values
- Python Pillow - Change the Color by Changing the Pixel Values
- Image Manipulation
- Python Pillow - Reducing Noise
- Python Pillow - Changing Image Modes
- Python Pillow - Compositing Images
- Python Pillow - Working with Alpha Channels
- Python Pillow - Applying Perspective Transforms
- Image Filtering
- Python Pillow - Adding Filters to an Image
- Python Pillow - Convolution Filters
- Python Pillow - Blur an Image
- Python Pillow - Edge Detection
- Python Pillow - Embossing Images
- Python Pillow - Enhancing Edges
- Python Pillow - Unsharp Mask Filter
- Image Enhancement and Correction
- Python Pillow - Enhancing Contrast
- Python Pillow - Enhancing Sharpness
- Python Pillow - Enhancing Color
- Python Pillow - Correcting Color Balance
- Python Pillow - Removing Noise
- Image Analysis
- Python Pillow - Extracting Image Metadata
- Python Pillow - Identifying Colors
- Advanced Topics
- Python Pillow - Creating Animated GIFs
- Python Pillow - Batch Processing Images
- Python Pillow - Converting Image File Formats
- Python Pillow - Adding Padding to an Image
- Python Pillow - Color Inversion
- Python Pillow - M L with Numpy
- Python Pillow with Tkinter BitmapImage and PhotoImage objects
- Image Module
- Python Pillow - Image Blending
- Python Pillow Useful Resources
- Python Pillow - Quick Guide
- Python Pillow - Function Reference
- Python Pillow - Useful Resources
- Python Pillow - Discussion
Python Pillow - ImageOps.solarize() Function
The PIL.ImageOps.solarize function is used to invert pixel values above a specified threshold in a greyscale image.
Syntax
Following is the syntax of the function −
PIL.ImageOps.solarize(image, threshold=128)
Parameters
Here are the details of this function parameters −
image − The image to solarize.
threshold − All pixels above this greyscale level are inverted. The default threshold is set to 128, which means that pixels with intensity values greater than 128 will be inverted.
Return Value
The function returns a new image object where pixel values above the specified threshold have been inverted.
Examples
Example 1
In this example, the ImageOps.solarize function is used to invert pixel values above the default threshold of 128 in the input image.
from PIL import Image, ImageOps
# Open an image file
input_image = Image.open("Images/butterfly.jpg")
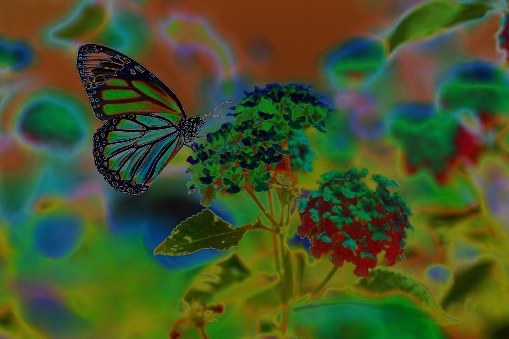
# Solarize the image with the default threshold
solarized_image = ImageOps.solarize(input_image)
# Display the original and solarized images
input_image.show()
solarized_image.show()
Output
Input Image
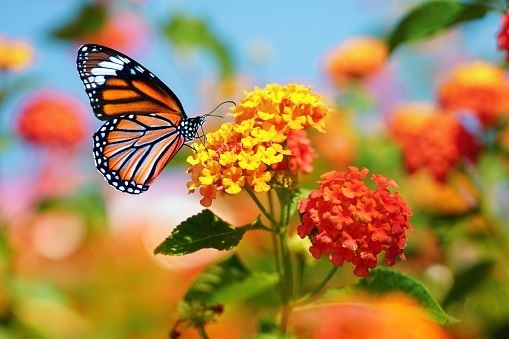
Output Image
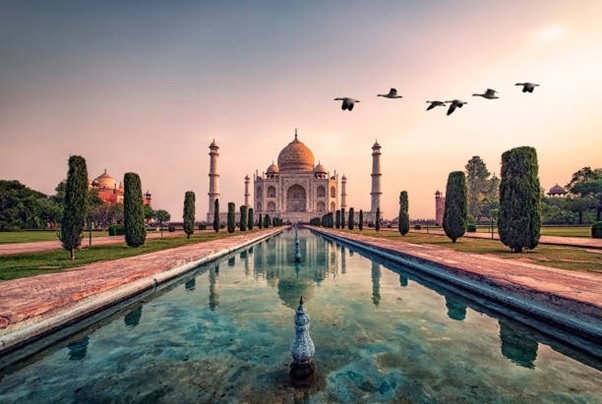
Example 2
Here's another example using the PIL.ImageOps.solarize() function with a different image and different threshold.
from PIL import Image, ImageOps
# Open an image file
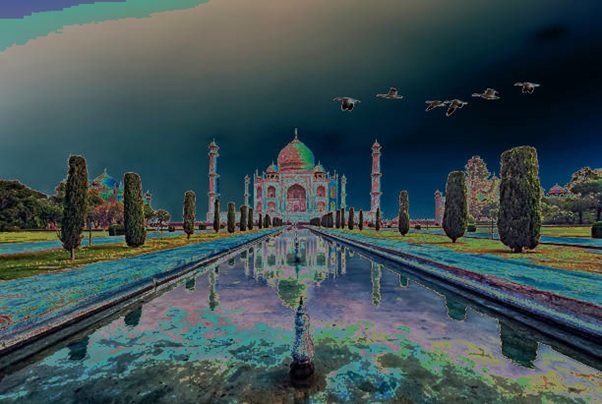
input_image = Image.open("Images/Tajmahal_2.jpg")
# Solarize the image with a specific threshold
solarized_image = ImageOps.solarize(input_image, threshold=100)
# Display the original and solarized images
input_image.show()
solarized_image.show()
Output
Input Image
Output Image
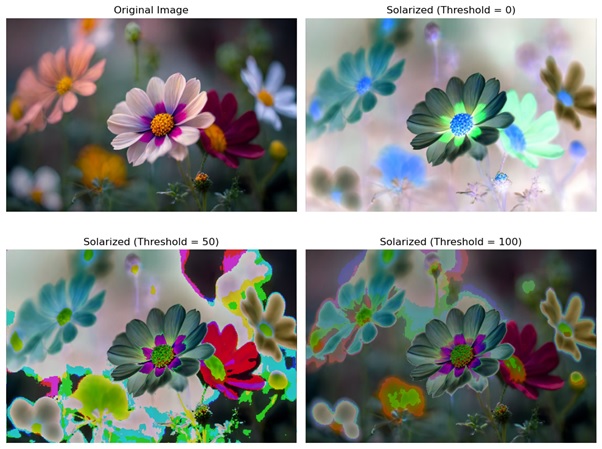
Example 3
In this example, the code performs solarization with different threshold values of an image, and the results are displayed using Matplotlib.
from PIL import Image, ImageOps
import matplotlib.pyplot as plt

# Open an image file
input_image = Image.open("Images/flowers_1.jpg")

# Define three different thresholds
thresholds = [0, 50, 100]

# Create subplots for original and solarized images
num_thresholds = len(thresholds) + 1
fig, axes = plt.subplots(2, 2, figsize=(10, 8))
ax = axes.ravel()

# Display the original image
ax[0].imshow(input_image)
ax[0].set_title('Original Image')
ax[0].axis('off')

# Solarize the image with different thresholds and display the results
for idx, threshold in enumerate(thresholds, start=1):
   solarized_image = ImageOps.solarize(input_image, threshold=threshold)

   # Display the solarized images
   ax[idx].imshow(solarized_image)
   ax[idx].set_title(f'Solarized (Threshold = {threshold})')
   ax[idx].axis('off')

plt.tight_layout()
plt.show()
Output