- Tables, Graphs, Functions and Sequences
- Home
- Making a table and plotting points given a unit rate
- Graphing whole number functions
- Function tables with two-step rules
- Writing a function rule given a table of ordered pairs: One-step rules
- Graphing a line in quadrant 1
- Interpreting a line graph
- Finding outputs of a one-step function that models a real-world situation
- Finding outputs of a two-step function with decimals that models a real-world situation
- Writing and evaluating a function that models a real-world situation: Basic
- Graphing ordered pairs and writing an equation from a table of values in context
- Writing an equation and drawing its graph to model a real-world situation: Basic
- Identifying independent and dependent quantities from tables and graphs
- Finding the next terms of an arithmetic sequence with whole numbers
- Finding the next terms of a geometric sequence with whole numbers
- Finding patterns in shapes
Making a table and plotting points given a unit rate
Definition
Unit rate is defined as a ratio in which denominator is 1. In general, a unit rate is the number of dependent variables per one independent variable.
For example − A monkey eats 8 bananas in 2 minutes
The unit rate here is the number of bananas the monkey eats in a minute.
Unit rate = 8/2 = 4 bananas per minute.
Unit rate and table
If we have a proportional relationship like for example $9 for 3 kg, we can make a table of values and graph the relationship. We already have learnt about unit rate. In this case the unit rate is the number of dollars per 1 kg. Here the unit rate is found as $9/3kg = $3/kg.
In a table or graph, representing proportional relationships, the constant of proportionality and the unit rate are same.
Given a unit rate we can write pairs of x and y values following the proportional relationship as follows. For example if the unit rate is $3/kg we can write (1kg, $3), (2 kg, $6), (3 kg, $9), (4 kg, $12), (5 kg, $15) and so on. We then put these ordered pairs in a table as follows.
| Weight in kg(x) | Cost in $(y) |
|---|---|
| 1 | 3 |
| 2 | 6 |
| 3 | 9 |
| 4 | 12 |
| 5 | 15 |
Unit rate and graph
The proportional relationship for given rate $3/kg can be written as an equation y = 3x. The same can be plotted as a graph given below.
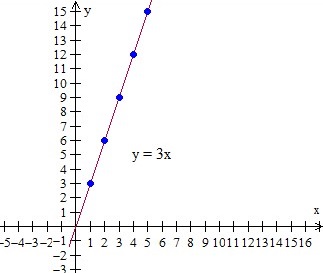
Given a unit rate, we can write a function rule like y = mx, where m is the unit rate, x and y are the variables. Using this rule we can find points with x and y values which can be put in a table. Then we plot these points on a graph.
Example 1
The relationship having unit rate is given by the equation: y = 2x + 1 Make a table and plot 5 points.
Solution
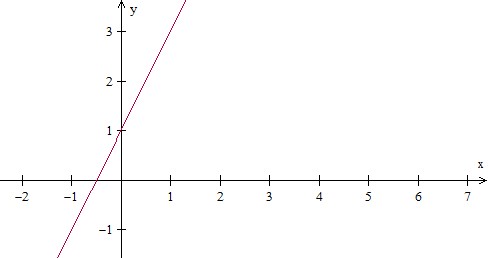
Step 1:
In the equation y = 2x + 1,
For x = 0, y = 1, for x = 1, y = 3 and so on
For different values of x, we get the following table
| Input(x) | Output(y) |
|---|---|
| 0 | 1 |
| 1 | 3 |
| 2 | 5 |
| 3 | 7 |
| 4 | 9 |
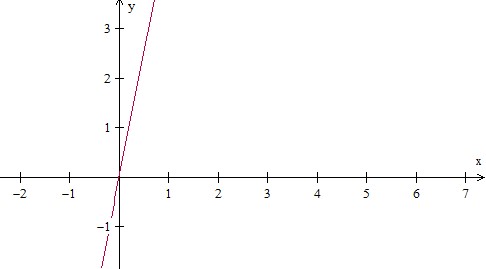
Step 2:
Plotting these points we get this graph
Example 2
The relationship having unit rate is given by the equation: y = 5x. Make a table and plot 5 points.
Solution
Step 1:
In the equation y = 5x
For x = 0, y = 0, for x = 1, y = 5 and so on
For different values of x, we get the following table
| Input(x) | Output(y) |
|---|---|
| 0 | 0 |
| 1 | 5 |
| 2 | 10 |
| 3 | 15 |
| 4 | 20 |
Step 2:
Plotting these points we get this graph