- Tables, Graphs, Functions and Sequences
- Home
- Making a table and plotting points given a unit rate
- Graphing whole number functions
- Function tables with two-step rules
- Writing a function rule given a table of ordered pairs: One-step rules
- Graphing a line in quadrant 1
- Interpreting a line graph
- Finding outputs of a one-step function that models a real-world situation
- Finding outputs of a two-step function with decimals that models a real-world situation
- Writing and evaluating a function that models a real-world situation: Basic
- Graphing ordered pairs and writing an equation from a table of values in context
- Writing an equation and drawing its graph to model a real-world situation: Basic
- Identifying independent and dependent quantities from tables and graphs
- Finding the next terms of an arithmetic sequence with whole numbers
- Finding the next terms of a geometric sequence with whole numbers
- Finding patterns in shapes
Graphing a line in quadrant 1
Introduction
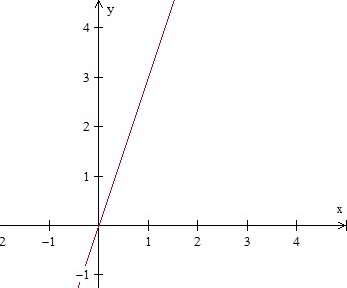
We graph a line whose equation is given, say for example y = 3x. We need at least two points or ordered pairs to graph the line. First we choose some x values. Then we evaluate y = 3x for each value of x.
For example for x = 0, y = 3(0) = 0; x = 1, y = 3(1) = 3 and so on. We put the x, y and the ordered pair (x, y) values as follows.
| x | y | (x,y) |
|---|---|---|
| 0 | 3(0) = 0 | (0,0) |
| 1 | 3(1) = 3 | (1,3) |
| 2 | 3(2) = 6 | (2,6) |
| 3 | 3(3) = 9 | (3,9) |
| 4 | 3(4) = 12 | (4,12) |
We see that the ordered pairs lie in the quadrant 1. Joining the points will give the graph of the line in quadrant 1.
Example 1
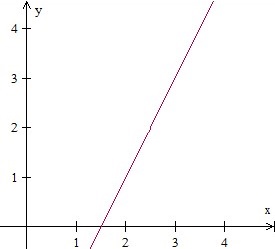
Graph the line in the quadrant 1, whose equation is given below.
2x y = 3
Solution
Step 1:
Given equation 2x y = 3; for y = 0, x = 3/2; for x = 2, y = 2(2)3 = 43 = 1. So two ordered pairs are (3/2, 0) (2, 1)
Step 2:
Plotting the points and joining with a line we get
Example 2
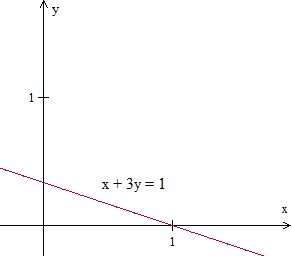
Graph the line in the quadrant 1, whose equation is given below.
x + 3y = 1
Solution
Step 1:
Given equation x + 3y = 1; for y = 0, x = 1; For x = 0, y = 1/3. So two ordered pairs are (1, 0) and (0, 1/3)
Step 2:
Plotting the points and joining with a line we get