- Tables, Graphs, Functions and Sequences
- Home
- Making a table and plotting points given a unit rate
- Graphing whole number functions
- Function tables with two-step rules
- Writing a function rule given a table of ordered pairs: One-step rules
- Graphing a line in quadrant 1
- Interpreting a line graph
- Finding outputs of a one-step function that models a real-world situation
- Finding outputs of a two-step function with decimals that models a real-world situation
- Writing and evaluating a function that models a real-world situation: Basic
- Graphing ordered pairs and writing an equation from a table of values in context
- Writing an equation and drawing its graph to model a real-world situation: Basic
- Identifying independent and dependent quantities from tables and graphs
- Finding the next terms of an arithmetic sequence with whole numbers
- Finding the next terms of a geometric sequence with whole numbers
- Finding patterns in shapes
Identifying independent and dependent quantities from tables and graphs
Introduction
Many real-world situations involve two variable quantities in which one quantity depends on the other. The quantity that depends on the other quantity is called the dependent variable, and the quantity it depends on is called the independent variable. The values of variables are used in tables and in plotting graphs.
In this lesson, we identify the dependent variable and the independent variable in a table or a graph.
Example 1
Identify the dependent and independent variables in the following problem.
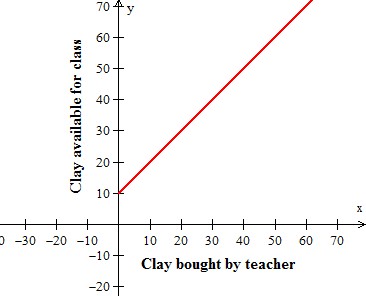
Solution
Independent variable is Clay bought by teacher; Dependent variable is Clay available for class
Example 2
Identify the dependent and independent variables in the following problem.
Time in years versus the weight in pounds is shown in the table below.
| Time in years(x) | 0 | 1 | 2 | 3 |
|---|---|---|---|---|
| Weighr in pounds(y) | 0 | 60 | 120 | 180 |
Solution
Independent variable is Time in years; Dependent variable is Weight in pounds.