- Tables, Graphs, Functions and Sequences
- Home
- Making a table and plotting points given a unit rate
- Graphing whole number functions
- Function tables with two-step rules
- Writing a function rule given a table of ordered pairs: One-step rules
- Graphing a line in quadrant 1
- Interpreting a line graph
- Finding outputs of a one-step function that models a real-world situation
- Finding outputs of a two-step function with decimals that models a real-world situation
- Writing and evaluating a function that models a real-world situation: Basic
- Graphing ordered pairs and writing an equation from a table of values in context
- Writing an equation and drawing its graph to model a real-world situation: Basic
- Identifying independent and dependent quantities from tables and graphs
- Finding the next terms of an arithmetic sequence with whole numbers
- Finding the next terms of a geometric sequence with whole numbers
- Finding patterns in shapes
Graphing whole number functions
Introduction
A function is a rule that takes in and works on an input and gives an output. It is usually represented as f(x) = y, where x is the input variable and y is the output variable.
By giving different whole number values to x, values of y can be found from the function rule. The x and y values are put in a table and then plotted as a graph.
Plotting a graph
So, from a function rule, x and y values can found and put in a table and also plotted as a graph.
Conversely, from a graph we can find x and y values and make a table of those values and find the function rule for the given graph also.
Example 1
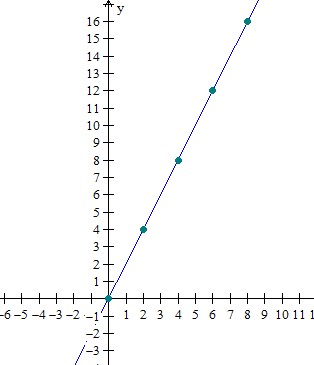
The table below describes a function. Graph this function.
| Input(x) | Output(y) |
|---|---|
| 0 | 0 |
| 2 | 4 |
| 4 | 8 |
| 6 | 12 |
| 8 | 16 |
Solution
Step 1:
From the table, we get the coordinates of the points as (0, 0), (2, 4), (4, 8), (6, 12), and (8, 16)
Step 2:
Making a plot of these points, we get
Example 2
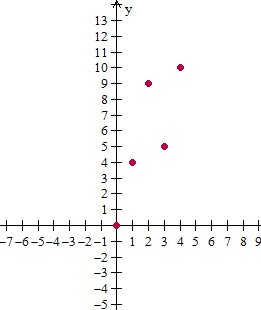
The graph of a function is given below. Fill in the table for this function.
Solution
Step 1:
From the graph plot, we get the coordinates of the points as (0, 0), (1, 4), (2, 9), (3, 5), and (4, 10)
Step 2:
Making a table of the x and y values, we get
| Input(x) | Output(y) |
|---|---|
| 0 | 0 |
| 1 | 4 |
| 2 | 9 |
| 3 | 5 |
| 4 | 10 |