- Tables, Graphs, Functions and Sequences
- Home
- Making a table and plotting points given a unit rate
- Graphing whole number functions
- Function tables with two-step rules
- Writing a function rule given a table of ordered pairs: One-step rules
- Graphing a line in quadrant 1
- Interpreting a line graph
- Finding outputs of a one-step function that models a real-world situation
- Finding outputs of a two-step function with decimals that models a real-world situation
- Writing and evaluating a function that models a real-world situation: Basic
- Graphing ordered pairs and writing an equation from a table of values in context
- Writing an equation and drawing its graph to model a real-world situation: Basic
- Identifying independent and dependent quantities from tables and graphs
- Finding the next terms of an arithmetic sequence with whole numbers
- Finding the next terms of a geometric sequence with whole numbers
- Finding patterns in shapes
Graphing ordered pairs and writing an equation from a table of values in context
Introduction
In this lesson, given a table of values, graphs are plotted from ordered pairs and equations are written.
Suppose we are given a table showing x and y values. The independent variable is represented by x and the dependent variable is represented by y and we have the ordered pairs of (x, y).
From the ordered pairs, a graph is plotted
From the table of values, an equation is found giving the relation between x and y.
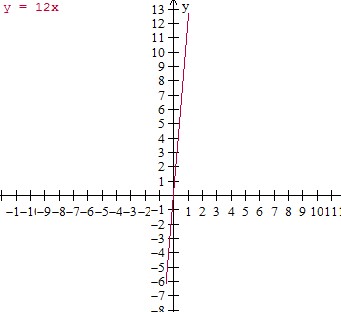
Example 1
Plot the ordered pairs described by the table. Write an equation relating x and y.
| Input(x) | Output(y) |
|---|---|
| 0 | 0 |
| 1 | 12 |
| 2 | 24 |
| 3 | 36 |
| 4 | 48 |
Solution
Step 1:
The equation of the ordered pairs of given table is
y = 12x
Step 2:
The plot of the ordered pairs of given table −
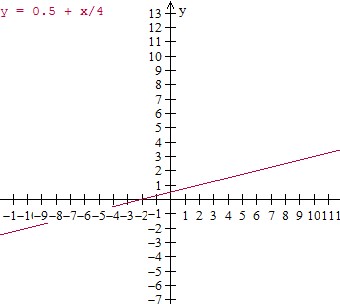
Example 2
Plot the ordered pairs described by the table. Write an equation relating x and y.
| Input(x) | Output(y) |
|---|---|
| 0 | 0.5 |
| 4 | 1.5 |
| 8 | 2.5 |
| 12 | 3.5 |
| 16 | 4.5 |
Solution
Step 1:
The equation of the ordered pairs of given table is
y = 0.5 + $\frac{x}{4}$
Step 2:
The plot of the ordered pairs of given table −