- Python XlsxWriter - Home
- Python XlsxWriter - Overview
- Python XlsxWriter - Environment Setup
- Python XlsxWriter - Hello World
- Python XlsxWriter - Important classes
- Python XlsxWriter - Cell Notation & Ranges
- Python XlsxWriter - Defined Names
- Python XlsxWriter - Formula & Function
- Python XlsxWriter - Date and Time
- Python XlsxWriter - Tables
- Python XlsxWriter - Applying Filter
- Python XlsxWriter - Fonts & Colors
- Python XlsxWriter - Number Formats
- Python XlsxWriter - Border
- Python XlsxWriter - Hyperlinks
- Python XlsxWriter - Conditional Formatting
- Python XlsxWriter - Adding Charts
- Python XlsxWriter - Chart Formatting
- Python XlsxWriter - Chart Legends
- Python XlsxWriter - Bar Chart
- Python XlsxWriter - Line Chart
- Python XlsxWriter - Pie Chart
- Python XlsxWriter - Sparklines
- Python XlsxWriter - Data Validation
- Python XlsxWriter - Outlines & Grouping
- Python XlsxWriter - Freeze & Split Panes
- Python XlsxWriter - Hide/Protect Worksheet
- Python XlsxWriter - Textbox
- Python XlsxWriter - Insert Image
- Python XlsxWriter - Page Setup
- Python XlsxWriter - Header & Footer
- Python XlsxWriter - Cell Comments
- Python XlsxWriter - Working with Pandas
- Python XlsxWriter - VBA Macro
Python XlsxWriter - Outlines & Grouping
In Excel, you can group rows or columns having same value of a particular column (or row)) so that they can be hidden or displayed with a single mouse click. This feature is called to as outlines and grouping. It helps in displaying sub-totals or summaries. This feature can be found in MS excel software's Data→Outline group.
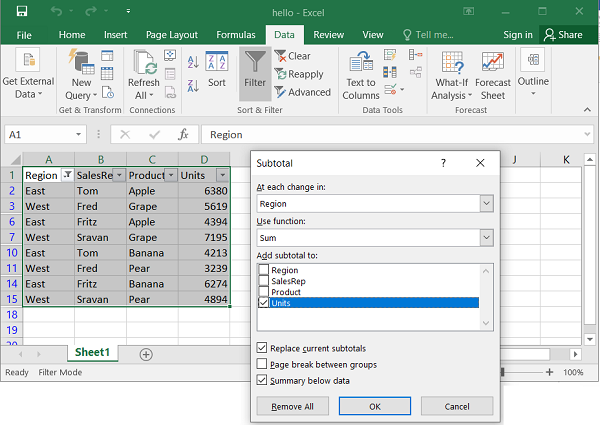
To use this feature, the data range must have all rows should be in the sorted order of values in one column. Suppose we have sales figures of different items. After sorting the range on name of item, click on the Subtotal option in the Outline group. Following dialog box pops up.
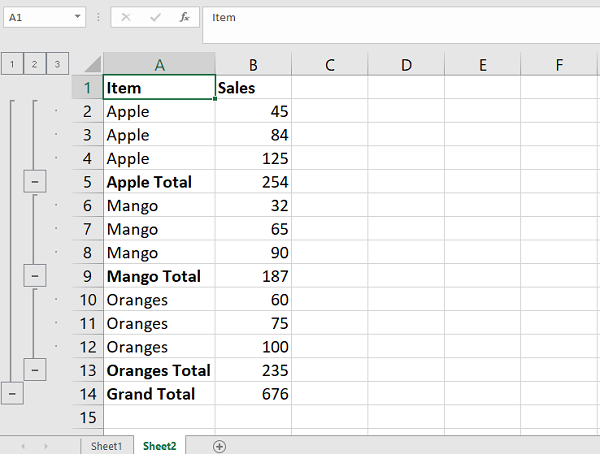
The worksheet shows item-wise subtotal of sales and at the end the grand total. On the left of the worksheet, the outline levels are shown. The original data is at level 3, the subtotals at level 2 and grand total at level 1.
Working with Outlines and Grouping
To do this using XlsxWriter, we need to use the level property of the set_row() method. The data rows are set at level 2.
ws.set_row(row, None, None, {'level': 2})
The rows for subtotal are having level 1.
ws.set_row(row, None, None, {'level': 1})
We use SUBTOTAL() function to calculate and display the sum of sales figures in one group.
Example
The complete code is given below −
import xlsxwriter
wb = xlsxwriter.Workbook('hello.xlsx')
ws = wb.add_worksheet()

headings=['Item', 'Sales']
data=[
   ['Apple', 45], ['Apple', 84], ['Apple', 125],
   ['Mango', 32], ['Mango', 65], ['Mango', 90],
   ['Oranges', 60], ['Oranges', 75], ['Oranges',100],
]
ws.write_row('A1', headings)
item='Apple'
rownum=1
startrow=1
for row in data:
   if row[0]==item:
      ws.set_row(rownum, None, None, {'level': 2})
      ws.write_row(rownum,0, row)
      rownum+=1
else:
   ws.set_row(rownum, None, None, {'level': 1})
   ws.write(rownum, 0, item+' Subtotal')
   cellno='B{}:B{}'.format(startrow,rownum)
   print (cellno)
   ws.write(rownum,1,'=SUBTOTAL(9,'+cellno+')')
   # rownum+=1
   item=data[rownum][0]
   rownum+=1
   ws.set_row(rownum, None, None, {'level': 2})
   ws.write_row(rownum,0, row)
   rownum+=1
   startrow=rownum
else:
   ws.set_row(rownum, None, None, {'level': 1})
   ws.write(rownum, 0, item+' Subtotal')
   cellno='B{}:B{}'.format(startrow,rownum)
   ws.write(rownum,1,'=SUBTOTAL(9,'+cellno+')')
rownum+=1
ws.write(rownum, 0, 'Grand Total')
cellno='B{}:B{}'.format(1,rownum)
ws.write(rownum,1,'=SUBTOTAL(9,'+cellno+')')

wb.close()
Output
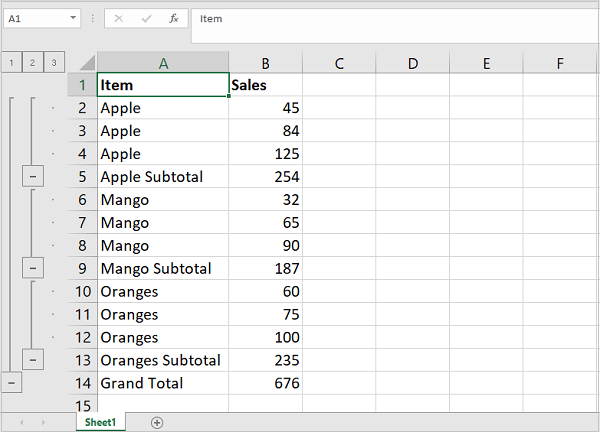
Run the code and open hello.xlsx using Excel. As we can see, the outlines are displayed on the left.
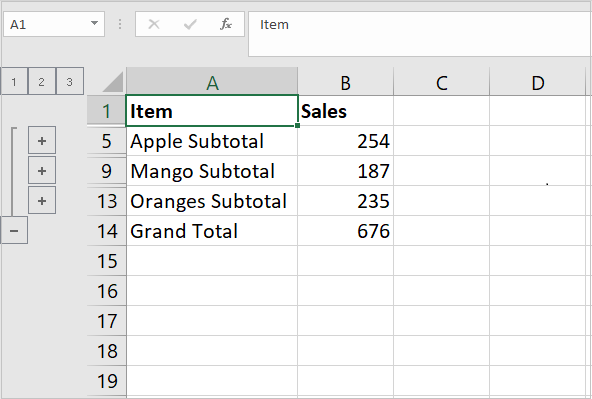
At each level, the minus sign indicates that the rows can be collapsed and only the subtotal row will be displayed.
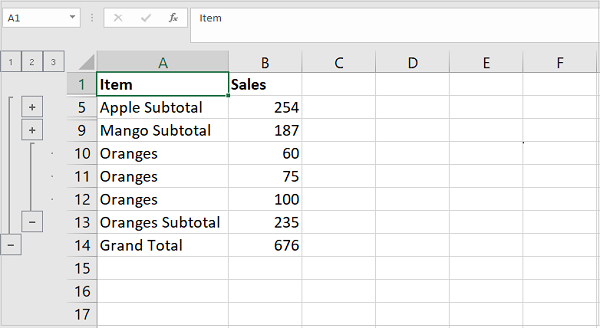
This figure shows all rows at level 2 have been collapsed. It now shows plus symbol in the outline which means that the data rows can be expanded. If you click the minus symbol at level 1, only the grand total will remain on the worksheet.