- LeafletJS Tutorial
- LeafletJS - Home
- LeafletJS - Getting Started
- LeafletJS - Markers
- LeafletJS - Vector Layers
- LeafletJS - Multi Polyline & Polygon
- LeafletJS - Layers Group
- LeafletJS - Event Handling
- LeafletJS - Overlays
- LeafletJS - Controls
- LeafletJS Useful Resources
- LeafletJS - Quick Guide
- LeafletJS - Useful Resources
- LeafletJS - Discussion
LeafletJS - Quick Guide
LeafletJS - Getting Started
What is Leaflet.js
Leaflet.js is an open-source library using which we can deploy simple, interactive, lightweight web maps.
Leaflet JavaScript library allows you to use layers such as Tile layers, WMS, Markers, Popups, Vector layers (polylines, polygons, circles, etc.), Image overlays and GeoJSON.
You can interact with the Leaflet maps by dragging the map, zooming (by double click or, wheel scroll), using keyboard, using event handling, and by dragging the markers.
Leaflet supports browsers such as Chrome, Firefox, Safari 5+, Opera 12+, IE 7–11 on desktop and, browsers like Safari, Android, Chrome, Firefox for mobiles.
Steps to Load the Map on a Webpage
Follow the steps given below to load a map on your webpage −
Step 1: Create an HTML Page
Create a basic HTML page with head and body tags as shown below −
<!DOCTYPE html>
<html>
   <head>
   </head>

   <body>
      ...........
   </body>
</html>
Step 2 : Load the Leaflet CSS Script
Include the Leaflet CSS script in the example −
<head>
   <link rel = "stylesheet" href = "http://cdn.leafletjs.com/leaflet-0.7.3/leaflet.css" />
</head>
Step 3: Load the Leaflet Script
Load or include the Leaflet API using the script tag −
<head>
   <script src = "http://cdn.leafletjs.com/leaflet-0.7.3/leaflet.js"></script>
</head>
Step 4: Create the Container
To hold the map, we have to create a container element. Generally, the <div> tag (a generic container) is used for this purpose.
Create a container element and define its dimensions −
<div id = "sample" style = "width:900px; height:580px;"></div>
Step 5: Map Options
Leaflet provides several options such as types Control options, Interaction Options, Map State Options, Animation Options, etc. By setting values to these, we can customize the map as desired.
Create a mapOptions object (it is created just like a literal) and set values for the options center and zoom, where
center − As a value to this option, you need to pass a LatLng object specifying the location where we want to center the map. (Just specify the latitude and longitude values within [] braces)
zoom − As a value to this option, you need to pass an integer representing the zoom level of the map, as shown below.
var mapOptions = {
   center: [17.385044, 78.486671],
   zoom: 10
}
Step 6: Create a Map Object
Using the Map class of leaflet API, you can create a map on a page. You can create a map object by instantiating the called Map of the Leaflet API. While instantiating this class, you need to pass two parameters −
As a parameter to this option, you need to pass a String variable representing the DOM id or an instance of the <div> element. Here, the <div>element is an HTML container to hold the map.
An optional object literal with map options.
Create a Map object by passing the id of the <div> element and mapOptions object created in the previous step.
var map = new L.map('map', mapOptions);
Step 7: Creating the Layer Object
You can load and display various types of maps (tile layers) by instantiating the TileLayer class. While instantiating it you need to pass an URL template requesting the desired tile layer(map) from the service provider, in the form of a String variable.
Create the tile layer object as shown below.
var layer = new L.TileLayer('http://{s}.tile.openstreetmap.org/{z}/{x}/{y}.png');
Here we have used the openstreetmap.
Step 8: Add Layer to the Map
Finally add the layer created in the previous step to the map object using the addlayer() method as shown below.
map.addLayer(layer);
Example
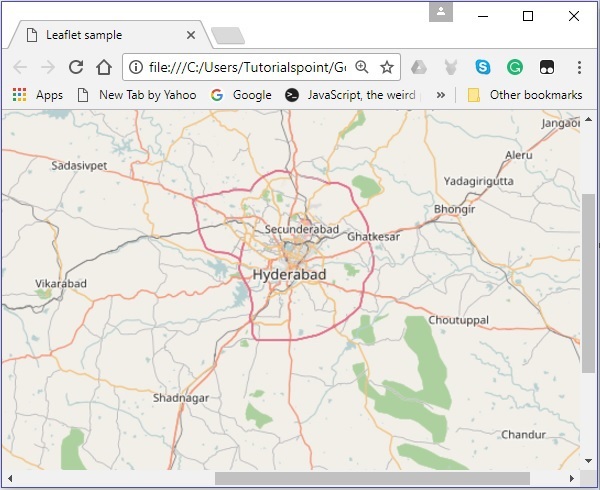
The following example shows how to load an open street map of Hyderabad city with a zoom value of 10.
<!DOCTYPE html>
<html>
   <head>
      <title>Leaflet sample</title>
      <link rel = "stylesheet" href = "http://cdn.leafletjs.com/leaflet-0.7.3/leaflet.css"/>
      <script src = "http://cdn.leafletjs.com/leaflet-0.7.3/leaflet.js"></script>
   </head>

   <body>
      <div id = "map" style = "width: 900px; height: 580px"></div>
      <script>
         // Creating map options
         var mapOptions = {
            center: [17.385044, 78.486671],
            zoom: 10
         }

         // Creating a map object
         var map = new L.map('map', mapOptions);

         // Creating a Layer object
         var layer = new L.TileLayer('http://{s}.tile.openstreetmap.org/{z}/{x}/{y}.png');

         // Adding layer to the map
         map.addLayer(layer);
      </script>
   </body>

</html>
It generates the following output −
Leaflet Map Providers
Just like open street map, you can load the layers of various service providers such as Open Topo, Thunder forest, Hydda, ESRI, Open weather, NASA GIBS, etc. To do so, you need to pass their respective URL while creating the TileLayer object
var layer = new L.TileLayer('URL of the required map');
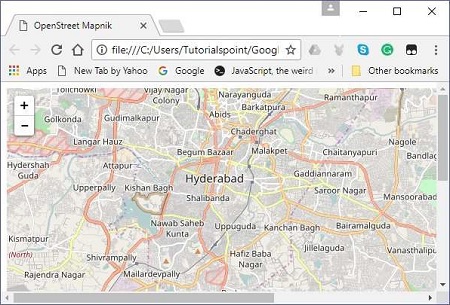
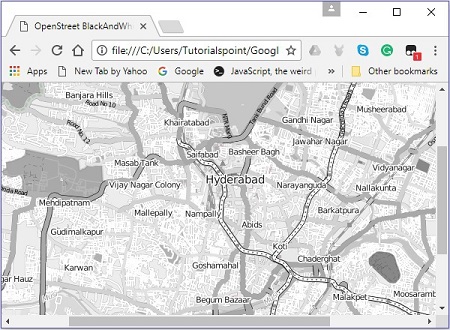
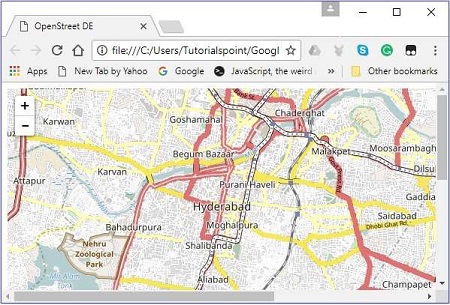
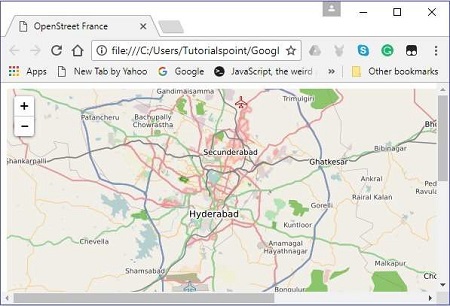
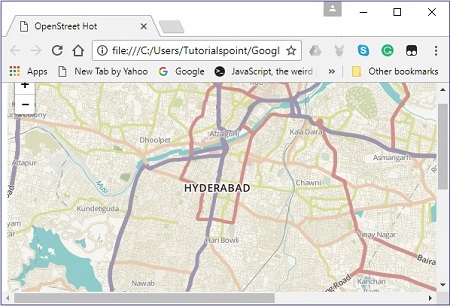
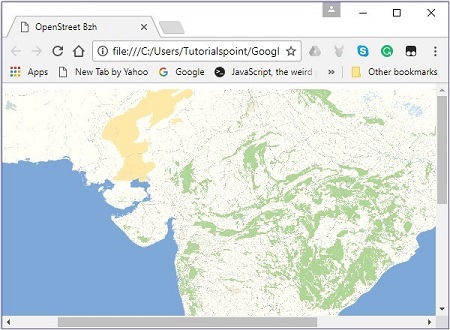
The following table lists the URL’s and their respective sample maps of the layers provided by Openstreetmap.
| Map Type | URL and Output |
|---|---|
| Mapnik | http://{s}.tile.openstreetmap.org/{z}/{x}/{y}.png
|
| Black And White | http://{s}.tiles.wmflabs.org/bw-mapnik/{z}/{x}/{y}.png
|
| DE | http://{s}.tile.openstreetmap.de/tiles/osmde/{z}/{x}/ {y}.png
|
| France | http://{s}.tile.openstreetmap.fr/osmfr/{z}/{x}/{y}.png
|
| Hot | http://{s}.tile.openstreetmap.fr/hot/{z}/{x}/{y}.png
|
| BZH | http://tile.openstreetmap.bzh/br/{z}/{x}/{y}.png
|
LeafletJS - Markers
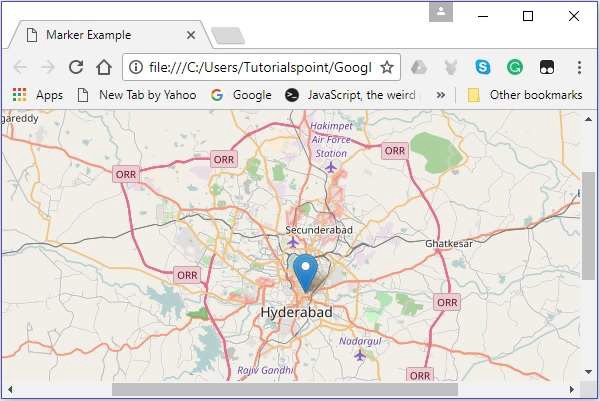
To mark a single location on the map, leaflet provides markers. These markers use a standard symbol and these symbols can be customized. In this chapter, we will see how to add markers and how to customize, animate, and remove them.
Adding a Simple Marker
To add a marker to a map using Leaflet JavaScript library, follow the steps given below −
Step 1 − Create a Map object by passing a <div> element (String or object) and map options (optional).
Step 2 − Create a Layer object by passing the URL of the desired tile.
Step 3 − Add the layer object to the map using the addLayer() method of the Map class.
Step 4 − Instantiate the Marker class by passing a latlng object representing the position to be marked, as shown below.
// Creating a marker
var marker = new L.Marker([17.385044, 78.486671]);
Step 5 − Add the marker object created in the previous steps to the map using the addTo() method of the Marker class.
// Adding marker to the map
marker.addTo(map);
Example
The following code sets the marker on the city named Hyderabad (India).
<!DOCTYPE html>
<html>
   <head>
      <title>Leaflet sample</title>
      <link rel = "stylesheet" href = "http://cdn.leafletjs.com/leaflet-0.7.3/leaflet.css"/>
      <script src = "http://cdn.leafletjs.com/leaflet-0.7.3/leaflet.js"></script>
   </head>

   <body>
      <div id = "map" style = "width:900px; height:580px"></div>
      <script>
         // Creating map options
         var mapOptions = {
            center: [17.385044, 78.486671],
            zoom: 10
         }
         // Creating a map object
         var map = new L.map('map', mapOptions);

         // Creating a Layer object
         var layer = new L.TileLayer('http://{s}.tile.openstreetmap.org/{z}/{x}/{y}.png');

         // Adding layer to the map
         map.addLayer(layer);

         // Creating a marker
         var marker = L.marker([17.385044, 78.486671]);

         // Adding marker to the map
         marker.addTo(map);
      </script>
   </body>

</html>
It generates the following output −
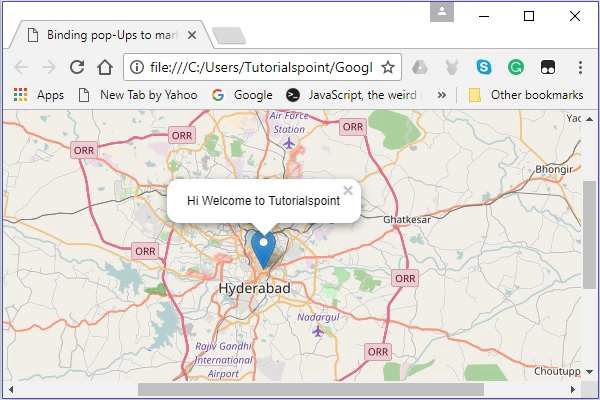
Binding Pop-ups to the Marker
To bind a simple popup displaying a message to a marker, follow the steps given below −
Step 1 − Create a Map object by passing a <div> element (String or object) and map options (optional).
Step 2 − Create a Layer object by passing the URL of the desired tile.
Step 3 − Add the layer object to the map using the addLayer() method of the Map class.
Step 4 − Instantiate the Marker class by passing a latlng object representing the position to be marked.
Step 5 − Attach popup to the marker using bindPopup() as shown below.
// Adding pop-up to the marker
marker.bindPopup('Hi Welcome to Tutorialspoint').openPopup();
Step 6 − Finally, add the Marker object created in the previous steps to the map using the addTo() method of the Marker class.
Example
The following code sets the marker on the city Hyderabad (India) and adds a pop-up to it.
<!DOCTYPE html>
<html>
   <head>
      <title>Binding pop-Ups to marker</title>
      <link rel = "stylesheet" href = "http://cdn.leafletjs.com/leaflet-0.7.3/leaflet.css"/>
      <script src = "http://cdn.leafletjs.com/leaflet-0.7.3/leaflet.js"></script>
   </head>

   <body>
      <div id = "map" style = "width:900px; height:580px"></div>
      <script>
         // Creating map options
         var mapOptions = {
            center: [17.385044, 78.486671],
            zoom: 15
         }
         var map = new L.map('map', mapOptions); // Creating a map object

         // Creating a Layer object
         var layer = new L.TileLayer('http://{s}.tile.openstreetmap.org/{z}/{x}/{y}.png');
         map.addLayer(layer);         // Adding layer to the map
         var marker = L.marker([17.438139, 78.395830]);    // Creating a Marker

         // Adding popup to the marker
         marker.bindPopup('This is Tutorialspoint').openPopup();
         marker.addTo(map); // Adding marker to the map
      </script>
   </body>

</html>
It generates the following output
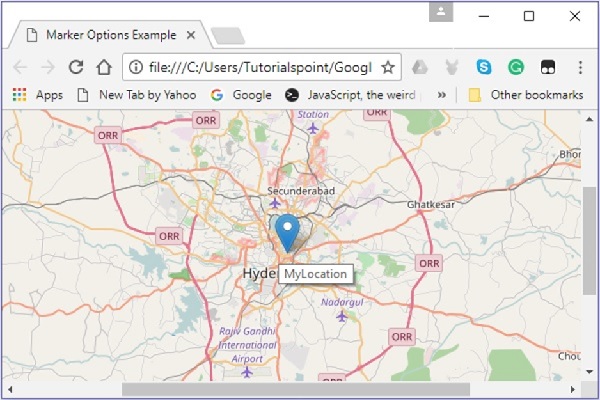
Marker Options
While creating a marker, you can also pass a marker options variable in addition to the latlang object. Using this variable, you can set values to various options of the marker such as icon, dragable, keyboard, title, alt, zInsexOffset, opacity, riseOnHover, riseOffset, pane, dragable, etc.
To create a map using map options, you need to follow the steps given below −
Step 1 − Create a Map object by passing a <div> element (String or object) and map options (optional).
Step 2 − Create a Layer object by passing the URL of the desired tile.
Step 3 − Add the layer object to the map using the addLayer() method of the Map class.
Step 4 − Create a variable for markerOptions and specify values to the required options.
Create a markerOptions object (it is created just like a literal) and set values for the options iconUrl and iconSize.
// Options for the marker
var markerOptions = {
   title: "MyLocation",
   clickable: true,
   draggable: true
}
Step 5 − Instantiate the Marker class by passing a latlng object representing the position to be marked and the options object, created in the previous step.
// Creating a marker
var marker = L.marker([17.385044, 78.486671], markerOptions);
Step 6 − Finally, add the Marker object created in the previous steps to the map using the addTo() method of the Marker class.
Example
The following code sets the marker on the city Hyderabad (India). This marker is clickable, dragable with the title MyLocation.
<html>
   <head>
      <title>Marker Options Example</title>
      <link rel = "stylesheet" href = "http://cdn.leafletjs.com/leaflet-0.7.3/leaflet.css"/>
      <script src = "http://cdn.leafletjs.com/leaflet-0.7.3/leaflet.js"></script>
   </head>

   <body>
      <div id = "map" style = "width:900px; height:580px"></div>
      <script>
         // Creating map options
         var mapOptions = {
            center: [17.385044, 78.486671],
            zoom: 10
         }
         // Creating a map object
         var map = new L.map('map', mapOptions);

         // Creating a Layer object
         var layer = new L.TileLayer('http://{s}.tile.openstreetmap.org/{z}/{x}/{y}.png');

         // Adding layer to the map
         map.addLayer(layer);

         // Creating a Marker
         var markerOptions = {
            title: "MyLocation",
            clickable: true,
            draggable: true
         }
         // Creating a marker
         var marker = L.marker([17.385044, 78.486671], markerOptions);

         // Adding marker to the map
         marker.addTo(map);
      </script>
   </body>

</html>
It generates the following output
Marker Custom Icons
Instead of the default icon provided by the Leaflet library, you can also add your own icon. You can use the following steps to add a custom icon to the map instead of the default one.
Step 1 − Create a Map object by passing a <div> element (String or object) and map options (optional).
Step 2 − Create a Layer object by passing the URL of the desired tile.
Step 3 − Add the layer object to the map using the addLayer() method of the Map class.
Step 4 − Create a variable for markerOptions and specify values to the required options −
iconUrl − As a value to this option, you need to pass a String object specifying the path of the image which you want to use as an icon.
iconSize − Using this option, you can specify the size of the icon.
Note − In addition to these, you can also set values to other options such as iconSize, shadowSize, iconAnchor, shadowAnchor, and popupAnchor.
Create a custom icon using L.icon() by passing the above options variable as shown below.
// Icon options
var iconOptions = {
   iconUrl: 'logo.png',
   iconSize: [50, 50]
}

// Creating a custom icon
var customIcon = L.icon(iconOptions);
Step 5 − Create a variable for markerOptions and specify values to the required options. In addition to these, specify the icon by passing the icon variable created in the previous step as a value.
// Options for the marker
var markerOptions = {
   title: "MyLocation",
   clickable: true,
   draggable: true,
   icon: customIcon
}
Step 6 − Instantiate the Marker class by passing a latlng object representing the position to be marked and the options object created in the previous step.
// Creating a marker
var marker = L.marker([17.438139, 78.395830], markerOptions);
Step 7 − Finally, add the Marker object created in the previous steps to the map using the addTo() method of the Marker class.
Example
The following code sets the marker on the location of Tutorialspoint. Here we are using the logo of Tutorialspoint instead of the default marker.
<!DOCTYPE html>
<html>
   <head>
      <title>Marker Custom Icons Example</title>
      <link rel = "stylesheet" href = "http://cdn.leafletjs.com/leaflet-0.7.3/leaflet.css"/>
      <script src = "http://cdn.leafletjs.com/leaflet-0.7.3/leaflet.js"></script>
   </head>

   <body>
      <div id = "map" style = "width:900px; height:580px"></div>
      <script>
         // Creating map options
         var mapOptions = {
            center: [17.438139, 78.395830],
            zoom: 10
         }
         // Creating a map object
         var map = new L.map('map', mapOptions);

         // Creating a Layer object
         var layer = new L.TileLayer('http://{s}.tile.openstreetmap.org/{z}/{x}/{y}.png');

         // Adding layer to the map
         map.addLayer(layer);

         // Icon options
         var iconOptions = {
            iconUrl: 'logo.png',
            iconSize: [50, 50]
         }
         // Creating a custom icon
         var customIcon = L.icon(iconOptions);

         // Creating Marker Options
         var markerOptions = {
            title: "MyLocation",
            clickable: true,
            draggable: true,
            icon: customIcon
         }
         // Creating a Marker
         var marker = L.marker([17.438139, 78.395830], markerOptions);

         // Adding popup to the marker
         marker.bindPopup('Hi welcome to Tutorialspoint').openPopup();

         // Adding marker to the map
         marker.addTo(map);
      </script>
   </body>

</html>
It generates the following output
LeafletJS - Vector Layers
In the previous chapter, we learned how to use markers in Leaflet. Along with markers, we can also add various shapes such as circles, polygons, rectangles, polylines, etc. In this chapter, we will discuss how to use the shapes provided by Google Maps.
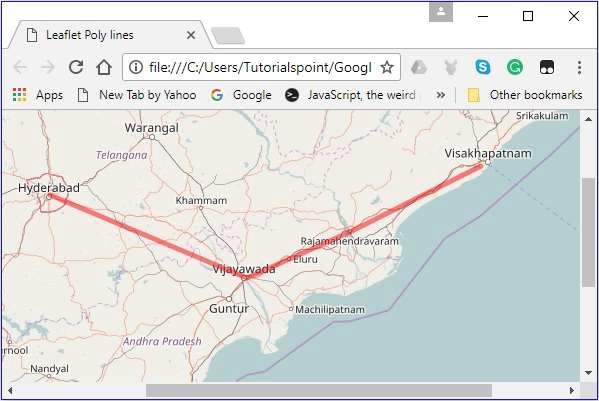
Polyline
To draw polyline overlay on a map using Leaflet JavaScript library, follow the steps given below −
Step 1 − Create a Map object by passing a <div> element (String or object) and map options (optional).
Step 2 − Create a Layer object by passing the URL of the desired tile.
Step 3 − Add the layer object to the map using the addLayer() method of the Map class.
Step 4 − Create a latlangs variable to hold the points to draw polyline, as shown below.
// Creating latlng object
var latlngs = [
   [17.385044, 78.486671],
   [16.506174, 80.648015],
   [17.000538, 81.804034],
   [17.686816, 83.218482]
];
Step 5 − Create a polyline using the L.polyline(). To draw the polyline, pass the locations as variable and an option to specify the color of the lines.
// Creating a poly line
var polyline = L.polyline(latlngs, {color: 'red'});
Step 6 − Add the polyline to the map using the addTo() method of the Polyline class.
// Adding to poly line to map
polyline.addTo(map);
Example
Following is the code which draws a polyline, covering the cities Hyderabad, Vijayawada, Rajamahendrawaram and, Vishakhapatnam (India).
DOCTYPE html>
<html>
   <head>
      <title>Leaflet Poly lines</title>
      <link rel = "stylesheet" href = "http://cdn.leafletjs.com/leaflet-0.7.3/leaflet.css"/>
      <script src = "http://cdn.leafletjs.com/leaflet-0.7.3/leaflet.js"></script>
   </head>

   <body>
      <div id = "map" style = "width:900px; height:580px"></div>
      <script>
         // Creating map options
         var mapOptions = {
            center: [16.506174, 80.648015],
            zoom: 7
         }
         // Creating a map object
         var map = new L.map('map', mapOptions);

         // Creating a Layer object
         var layer = new L.TileLayer('http://{s}.tile.openstreetmap.org/{z}/{x}/{y}.png');

         // Adding layer to the map
         map.addLayer(layer);

         // Creating latlng object
         var latlngs = [
            [17.385044, 78.486671],
            [16.506174, 80.648015],
            [17.000538, 81.804034],
            [17.686816, 83.218482]
         ];
         // Creating a poly line
         var polyline = L.polyline(latlngs, {color: 'red'});

         // Adding to poly line to map
         polyline.addTo(map);
      </script>
   </body>

</html>
It generates the following output
Polygon
To draw a polygon overlay on a map using Leaflet JavaScript library, follow the steps given below −
Step 1 − Create a Map object by passing a <div> element (String or object) and map options (optional).
Step 2 − Create a Layer object by passing the URL of the desired tile.
Step 3 − Add the layer object to the map using the addLayer() method of the Map class.
Step 4 − Create a latlangs variable to hold the points to draw the polygon.
// Creating latlng object
var latlngs = [
   [17.385044, 78.486671],
   [16.506174, 80.648015],
   [17.686816, 83.218482]
];
Step 5 − Create a polygon using the L.polygon(). Pass the locations/points as variable to draw the polygon, and an option to specify the color of the polygon.
// Creating a polygon
var polygon = L.polygon(latlngs, {color: 'red'});
Step 6 − Add the polygon to the map using the addTo() method of the Polygon class.
// Adding to polygon to map
polygon.addTo(map);
Example
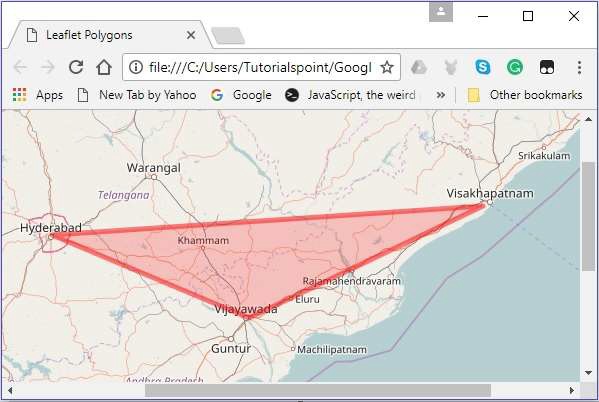
Following is the code to draw a polygon covering the cities Hyderabad, Vijayawada, and Vishakhapatnam (India).
<!DOCTYPE html>
<html>
   <head>
      <title>Leaflet Polygons</title>
      <link rel = "stylesheet" href = "http://cdn.leafletjs.com/leaflet-0.7.3/leaflet.css"/>
      <script src = "http://cdn.leafletjs.com/leaflet-0.7.3/leaflet.js"></script>
   </head>

   <body>
      <div id = "map" style = "width:900px; height:580px"></div>
      <script>
         // Creating map options
         var mapOptions = {
            center: [16.506174, 80.648015],
            zoom: 7
         }
         // Creating a map object
         var map = new L.map('map', mapOptions);

         // Creating a Layer object
         var layer = new L.TileLayer('http://{s}.tile.openstreetmap.org/{z}/{x}/{y}.png');

         // Adding layer to the map
         map.addLayer(layer);

         // Creating latlng object
         var latlngs = [
            [17.385044, 78.486671],
            [16.506174, 80.648015],
            [17.686816, 83.218482]
         ];
         // Creating a polygon
         var polygon = L.polygon(latlngs, {color: 'red'});

         // Adding to polygon to map
         polygon.addTo(map);
      </script>
   </body>

</html>
It generates the following output −
Rectangle
To draw a Rectangle overlay on a map using Leaflet JavaScript library, follow the steps given below
Step 1 − Create a Map object by passing a <div> element (String or object) and map options (optional).
Step 2 − Create a Layer object by passing the URL of the desired tile.
Step 3 − Add the layer object to the map using the addLayer() method of the Map class.
Step 4 − Create a latlangs variable to hold the points to draw a rectangle on the map.
// Creating latlng object
var latlngs = [
   [17.342761, 78.552432],
   [16.396553, 80.727725]
];
Step 5 − Create a rectangle using the L.rectangle() function. Pass the locations/points as a variable to draw a rectangle and rectangleOptions to specify the color and weight of the rectangle.
// Creating rectOptions
var rectOptions = {color: 'Red', weight: 1}

// Creating a rectangle
var rectangle = L.rectangle(latlngs, rectOptions);
Step 6 − Add the rectangle to the map using the addTo() method of the Polygon class.
// Adding to rectangle to map
rectangle.addTo(map);
Example
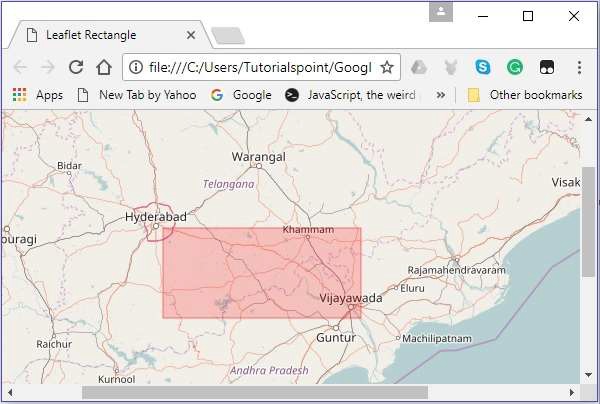
Following is the code to draw a rectangle on the map using Leaflet JavaScript library.
<!DOCTYPE html>
<html>
   <head>
      <title>Leaflet Rectangle</title>
      <link rel = "stylesheet" href = "http://cdn.leafletjs.com/leaflet-0.7.3/leaflet.css"/>
      <script src = "http://cdn.leafletjs.com/leaflet-0.7.3/leaflet.js"></script>
   </head>

   <body>
      <div id = "map" style = "width:900px; height:580px"></div>
      <script>
         // Creating map options
         var mapOptions = {
            center: [16.506174, 80.648015],
            zoom: 7
         }
         var map = new L.map('map', mapOptions); // Creating a map object

         // Creating a Layer object
         var layer = new L.TileLayer('http://{s}.tile.openstreetmap.org/{z}/{x}/{y}.png');
         map.addLayer(layer); // Adding layer to the map

         // Creating latlng object
         var latlngs = [
            [17.342761, 78.552432],
            [16.396553, 80.727725]
         ];
         var rectOptions = {color: 'Red', weight: 1}   // Creating rectOptions

         // Creating a rectangle
         var rectangle = L.rectangle(latlngs, rectOptions);
         rectangle.addTo(map);   // Adding to rectangle to map
      </script>
   </body>

</html>
It generates the following output −
Circle
To draw a circle overlay on a map using Leaflet JavaScript library follow the steps given below.
Step 1 − Create a Map object by passing a <div> element (String or object) and map options (optional).
Step 2 − Create a Layer object by passing the URL of the desired tile.
Step 3 − Add the layer object to the map using the addLayer() method of the Map class.
Step 4 − Create a latlangs variable to hold the center of the circle as shown below.
// Center of the circle
var circleCenter = [17.385044, 78.486671];
Step 5 − Create a variable circleOptions to specify values to the options color, fillColor and, fillOpacity as shown below.
// Circle options
var circleOptions = {
   color: 'red',
   fillColor: '#f03',
   fillOpacity: 0
}
Step 6 − Create a circle using L.circle(). Pass the center of the circle, radius, and the circle options to this function.
// Creating a circle
var circle = L.circle(circleCenter, 50000, circleOptions);
Step 7 − Add the above-created circle to the map using the addTo() method of the Polyline class.
// Adding circle to the map
circle.addTo(map);
Example
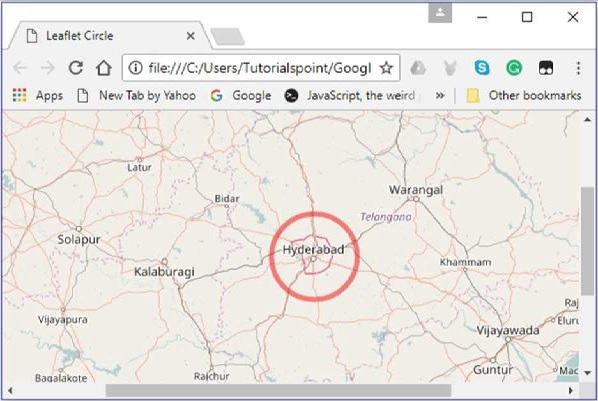
Following is the code to draw a circle with the coordinates of the city Hyderabad as its radius.
<!DOCTYPE html>
<html>
   <head>
      <title>Leaflet Circle</title>
      <link rel = "stylesheet" href = "http://cdn.leafletjs.com/leaflet-0.7.3/leaflet.css"/>
      <script src = "http://cdn.leafletjs.com/leaflet-0.7.3/leaflet.js"></script>
   </head>

   <body>
      <div id = "map" style = "width: 900px; height: 580px"></div>
      <script>
         // Creating map options
         var mapOptions = {
            center: [17.385044, 78.486671],
            zoom: 7
         }
         var map = new L.map('map', mapOptions); // Creating a map object

         // Creating a Layer object
         var layer = new L.TileLayer('http://{s}.tile.openstreetmap.org/{z}/{x}/{y}.png');
         map.addLayer(layer);        // Adding layer to the map
         var circleCenter = [17.385044, 78.486671];     // Center of the circle

         // Circle options
         var circleOptions = {
            color: 'red',
            fillColor: '#f03',
            fillOpacity: 0
         }
         // Creating a circle
         var circle = L.circle(circleCenter, 50000, circleOptions);
         circle.addTo(map);     // Adding circle to the map
      </script>
   </body>

</html>>
It generates the following output −
LeafletJS - Multi Polyline and Polygon
In the previous chapter, we learnt how to add various shapes such as circles, polygons, rectangles, polylines, etc. In this chapter, let us discuss how to add multi-polygons, multirectangles, and polylines.
Multi-Polyline
To draw a multi-polyline overlay on a map using Leaflet JavaScript library, follow the steps given below −
Step 1 − Create a Map object by passing a <div> element (String or object) and map options (optional).
Step 2 − Create a Layer object by passing the URL of the desired tile.
Step 3 − Add the layer object to the map using the addLayer() method of the Map class.
Step 4 − Create a latlangs variable to hold the points to draw the multi-polyline.
// Creating latlng object
var latlang = [
   [[17.385044, 78.486671], [16.506174, 80.648015], [17.686816, 83.218482]],
   [[13.082680, 80.270718], [12.971599, 77.594563],[15.828126, 78.037279]]
];
Step 5 − Create a multi-polyline using the L.multiPolyline() function. Pass the locations as variable to draw a multi-polyline and an option to specify the color and weight of the lines.
// Creating multi polyline options
var multiPolyLineOptions = {color:'red'};

// Creating multi polylines
var multipolyline = L.multiPolyline(latlang , multiPolyLineOptions);
Step 6 − Add multi-polyline to the map using the addTo() method of the Multipolyline class.
// Adding multi polyline to map
multipolyline.addTo(map);
Example
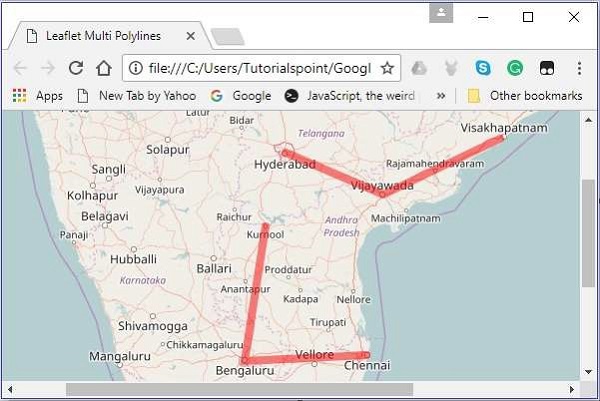
Following is the code to draw a multi-polyline covering the cities Hyderabad, Vijayawada, and Vishakhapatnam; and Kurnool, Bengaluru, and Chennai.
<!DOCTYPE html>
<html>
   <head>
      <title>Leaflet Multi Polylines</title>
      <link rel = "stylesheet" href = "http://cdn.leafletjs.com/leaflet-0.7.3/leaflet.css"/>
      <script src = "http://cdn.leafletjs.com/leaflet-0.7.3/leaflet.js"></script>
   </head>

   <body>
      <div id = "map" style = "width: 900px; height: 580px"></div>
      <script>
         // Creating map options
         var mapOptions = {
            center: [16.506174, 80.648015],
            zoom: 7
         }
         // Creating a map object
         var map = new L.map('map', mapOptions);

         // Creating a Layer object
         var layer = new L.TileLayer('http://{s}.tile.openstreetmap.org/{z}/{x}/{y}.png');

         // Adding layer to the map
         map.addLayer(layer);

         // Creating latlng object
         var latlang = [
            [[17.385044, 78.486671], [16.506174, 80.648015], [17.686816, 83.218482]],
            [[13.082680, 80.270718], [12.971599, 77.594563],[15.828126, 78.037279]]
         ];

         // Creating poly line options
         var multiPolyLineOptions = {color:'red'};

         // Creating multi poly-lines
         var multipolyline = L.multiPolyline(latlang , multiPolyLineOptions);

         // Adding multi poly-line to map
         multipolyline.addTo(map);
      </script>
   </body>

</html>
It generates the following output −
Multi Polygon
To draw a multi-polygon overlay on a map using Leaflet JavaScript library, follow the steps given below −
Step 1 − Create a Map object by passing a <div> element (String or object) and map options (optional).
Step 2 − Create a Layer object by passing the URL of the desired tile.
Step 3 − Add the layer object to the map using the addLayer() method of the Map class.
Step 4 − Create a latlangs variable to hold the points to draw the multi polygon.
// Creating latlng object
var latlang = [
   [[17.385044, 78.486671], [16.506174, 80.648015], [17.686816, 83.218482]],
   [[13.082680, 80.270718], [12.971599, 77.594563],[15.828126, 78.037279]]
];
Step 5 − Create a multi-polygon using the L.multiPolygon() function. Pass the locations as variable to draw the multi-polygon and an option to specify the color and weight of the lines.
// Creating multi polygon options
var multiPolygonOptions = {color:'red'};

// Creating multi polygon
var multipolygon = L.multiPolygon(latlang , multiPolygonOptions);
Step 6 − Add the multi-polygon to the map using the addTo() method of the MultiPolygon class.
// Adding multi polygon to map
multipolygon.addTo(map);
Example
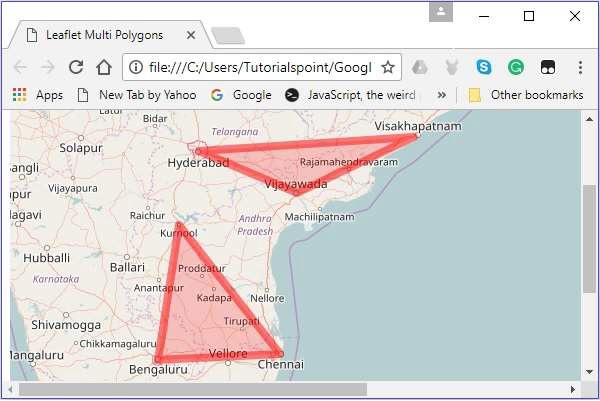
Following is the code to draw a multi-polygon touching the cities Hyderabad, Vijayawada, and Vishakhapatnam; and Kurnool, Bengaluru, and Chennai.
<!DOCTYPE html>
<html>
   <head>
      <title>Leaflet Multi Polygons</title>
      <link rel = "stylesheet" href = "http://cdn.leafletjs.com/leaflet-0.7.3/leaflet.css"/>
      <script src = "http://cdn.leafletjs.com/leaflet-0.7.3/leaflet.js"></script>
   </head>

   <body>
      <div id = "map" style = "width: 900px; height: 580px"></div>
      <script>
         // Creating map options
         var mapOptions = {
            center: [16.506174, 80.648015],
            zoom: 7
         }
         // Creating a map object
         var map = new L.map('map', mapOptions);

         // Creating a Layer object
         var layer = new L.TileLayer('http://{s}.tile.openstreetmap.org/{z}/{x}/{y}.png');

         // Adding layer to the map
         map.addLayer(layer);

         // Creating latlng object
         var latlang = [
            [[17.385044, 78.486671], [16.506174, 80.648015], [17.686816, 83.218482]],
            [[13.082680, 80.270718], [12.971599, 77.594563],[15.828126, 78.037279]]
         ];
         // Creating multi polygon options
         var multiPolygonOptions = {color:'red', weight:8};

         // Creating multi polygons
         var multipolygon = L.multiPolygon(latlang , multiPolygonOptions);

         // Adding multi polygon to map
         multipolygon.addTo(map);
      </script>
   </body>

</html>
It generates the following output −
LeafletJS - Layers Group
Layer Groups
Using layer group, you can add multiple layers to a map and manage them as a single layer.
Follow the steps given below to create a LayerGroup and add it to the map.
Step 1 − Create a Map object by passing a <div> element (String or object) and map options (optional).
Step 2 − Create a Layer object by passing the URL of the desired tile.
Step 3 − Add the layer object to the map using the addLayer() method of the Map class.
Step 4 − Create elements (layers) such as markers, polygons, circles, etc., that are needed, by instantiating the respective classes as shown below.
// Creating markers
var hydMarker = new L.Marker([17.385044, 78.486671]);
var vskpMarker = new L.Marker([17.686816, 83.218482]);
var vjwdMarker = new L.Marker([16.506174, 80.648015]);

// Creating latlng object
var latlngs = [
   [17.385044, 78.486671],
   [16.506174, 80.648015],
   [17.686816, 83.218482]
];
// Creating a polygon
var polygon = L.polygon(latlngs, {color: 'red'});
Step 5 − Create the Layer Group using l.layerGroup(). Pass the above created markers, polygons, etc., as shown below.
// Creating layer group
var layerGroup = L.layerGroup([hydMarker, vskpMarker, vjwdMarker, polygon]);
Step 6 − Add the layer group created in the previous step using the addTo() method.
// Adding layer group to map
layerGroup.addTo(map);
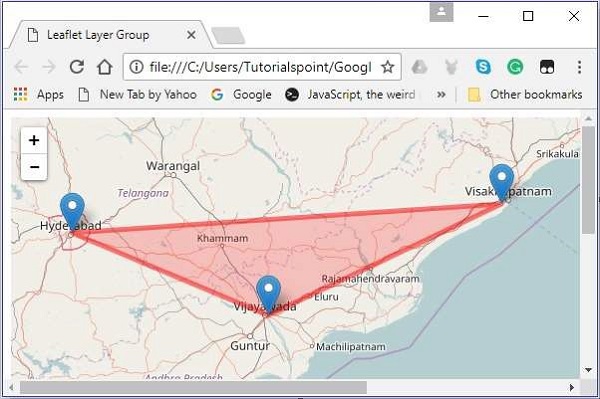
Example
The following code creates a layer group which holds 3 markers and a polygon, and adds it to the map.
<!DOCTYPE html>
<html>
   <head>
      <title>Leaflet Layer Group</title>
      <link rel = "stylesheet" href = "http://cdn.leafletjs.com/leaflet-0.7.3/leaflet.css"/>
      <script src = "http://cdn.leafletjs.com/leaflet-0.7.3/leaflet.js"></script>
   </head>

   <body>
      <div id = "map" style = "width: 900px; height: 580px"></div>
      <script>
         // Creating map options
         var mapOptions = {
            center: [17.385044, 78.486671],
            zoom: 7
         }
         var map = new L.map('map', mapOptions); // Creating a map object

         // Creating a Layer object
         var layer = new L.TileLayer('http://{s}.tile.openstreetmap.org/{z}/{x}/{y}.png');
         map.addLayer(layer);      // Adding layer to the map

         // Creating markers
         var hydMarker = new L.Marker([17.385044, 78.486671]);
         var vskpMarker = new L.Marker([17.686816, 83.218482]);
         var vjwdMarker = new L.Marker([16.506174, 80.648015]);

         // Creating latlng object
         var latlngs = [
            [17.385044, 78.486671],
            [16.506174, 80.648015],
            [17.686816, 83.218482]
         ];
         // Creating a polygon
         var polygon = L.polygon(latlngs, {color: 'red'});

         // Creating layer group
         var layerGroup = L.layerGroup([hydMarker, vskpMarker, vjwdMarker, polygon]);
         layerGroup.addTo(map);    // Adding layer group to map
      </script>
   </body>

</html>
It generates the following output −
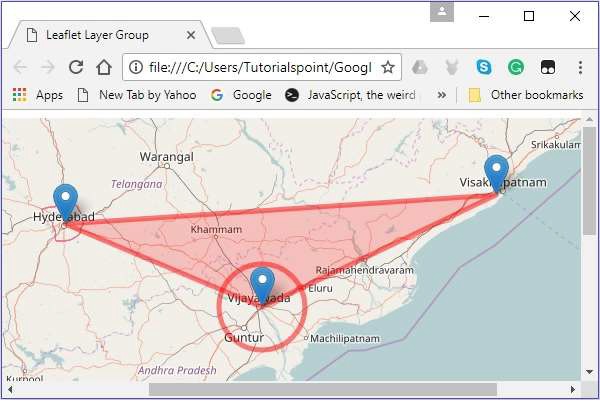
Adding a layer (element)
You can add a layer to the feature group using the addLayer() method. To this method, you need to pass the element that is to be added.
You can add a circle with the city Hyderabad at the center.
// Creating a circle
var circle = L.circle([16.506174, 80.648015], 50000, {color: 'red', fillColor:
   '#f03', fillOpacity: 0} );

// Adding circle to the layer group
layerGroup.addLayer(circle);
It will produce the following output. −
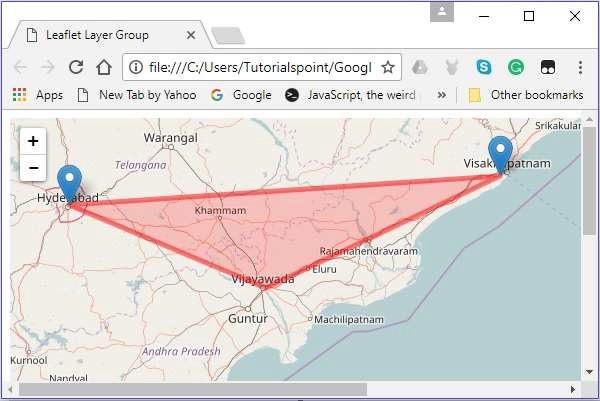
Removing a Layer (Element)
You can remove a layer from the feature group using the removeLayer() method. To this method, you need to pass the element that is to be removed.
You can remove the marker on the city named Vijayawada as shown below.
// Removing layer from map
layerGroup.removeLayer(vjwdMarker);
It will produce the following output −
Feature Groups
It is similar to LayerGroup but it allows mouse events and bind popups to it. You can also set style to the entire group using setStyle() method.
Follow the steps given below to create a Feature Group and add it to the map.
Step 1 − Create a Map object by passing a <div> element (String or object) and map options (optional).
Step 2 − Create a Layer object by passing the URL of the desired tile.
Step 3 − Add the layer object to the map using the addLayer() method of the Map class.
Step 4 − Create elements (layers) such as markers, polygons, and circles that are needed, by instantiating the respective classes as shown below.
// Creating markers
var hydMarker = new L.Marker([17.385044, 78.486671]);
var vskpMarker = new L.Marker([17.686816, 83.218482]);
var vjwdMarker = new L.Marker([16.506174, 80.648015]);

// Creating latlng object
var latlngs = [
   [17.385044, 78.486671],
   [16.506174, 80.648015],
   [17.686816, 83.218482]
];
// Creating a polygon
var polygon = L.polygon(latlngs, {color: 'red'});>
Step 5 − Create Feature Group using l.featureGroup(). Pass the above-created markers, polygons, etc., as shown below.
// Creating feature group
var featureGroup = L.featureGroup([hydMarker, vskpMarker, vjwdMarker, polygon]);
Step 6 − If you set style to the feature group, it will be applied to each element (layer) in the group. You can do so using the setStyle() method and to this method, you need to pass values to the options such as color and opacity etc.
Set the style to the feature group created in the above step.
// Setting style to the feature group
featureGroup.setStyle({color:'blue',opacity:.5});
Step 7 − Bind the popup using the bindPopup() method, as shown below.
// Binding popup to the feature group
featureGroup.bindPopup("Feature Group");
Step 8 − Add the feature group created in the previous step using the addTo() method.
// Adding layer group to map
featureGroup.addTo(map);
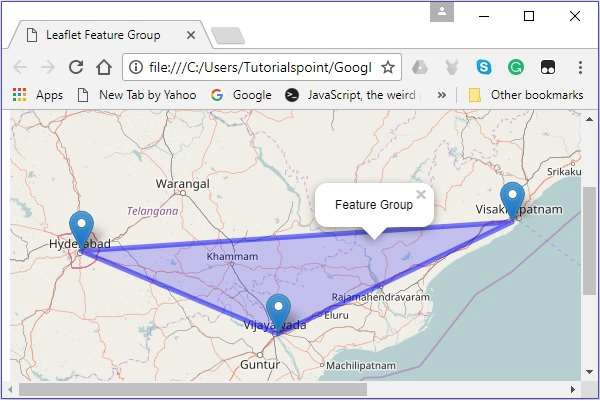
Example
The following code creates a feature group which holds 3 markers and a polygon, and adds it to the map.
<!DOCTYPE html>
<html>
   <head>
      <title>Leaflet Feature Group</title>
      <link rel = "stylesheet" href = "http://cdn.leafletjs.com/leaflet-0.7.3/leaflet.css"/>
      <script src = "http://cdn.leafletjs.com/leaflet-0.7.3/leaflet.js"></script>
   </head>

   <body>
      <div id = "map" style = "width:900px; height:580px"></div>
      <script>
         // Creating map options
         var mapOptions = {
            center: [17.385044, 78.486671],
            zoom: 7
         }
         var map = new L.map('map', mapOptions); // Creating a map object

         // Creating a Layer object
         var layer = new L.TileLayer('http://{s}.tile.openstreetmap.org/{z}/{x}/{y}.png');
         map.addLayer(layer);      // Adding layer to the map

         // Creating markers
         var hydMarker = new L.Marker([17.385044, 78.486671]);
         var vskpMarker = new L.Marker([17.686816, 83.218482]);
         var vjwdMarker = new L.Marker([16.506174, 80.648015]);

         // Creating latlng object
         var latlngs = [
            [17.385044, 78.486671],
            [16.506174, 80.648015],
            [17.686816, 83.218482]
         ];
         var polygon = L.polygon(latlngs, {color: 'red'}); // Creating a polygon

         // Creating feature group
         var featureGroup = L.featureGroup([hydMarker, vskpMarker, vjwdMarker, polygon]);
         featureGroup.setStyle({color:'blue',opacity:.5});
         featureGroup.bindPopup("Feature Group");
         featureGroup.addTo(map);      // Adding layer group to map
      </script>
   </body>

</html>
It generates the following output −
LeafletJS - Event Handling
The Leaflet JavaScript program can respond to various events generated by the user. In this chapter, we will provide a few examples demonstrating how to perform event handling while working with Leaflet.
Event Handling
Follow the steps given below to add events to the map.
Step 1 − Create a Map object by passing a <div> element (String or object) and map options (optional).
Step 2 − Create a Layer object by passing the URL of the desired tile.
Step 3 − Add the layer object to the map using the addLayer() method of the Map class.
Step 4 − Add the handler to the map, as shown below.
map.on("click", function(e){
   new L.Marker([e.latlng.lat, e.latlng.lng]).addTo(map);
})
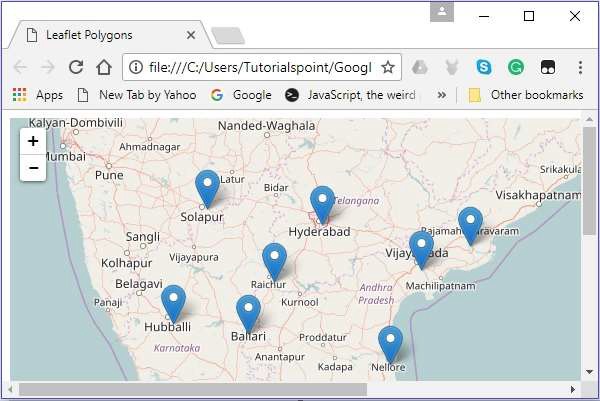
Example
The following code demonstrates even handling using Leaflet. When executed, if you click on the map, a marker will be created on that particular location.
<!DOCTYPE html>
<html>
   <head>
      <title>Leaflet Polygons</title>
      <link rel = "stylesheet" href = "http://cdn.leafletjs.com/leaflet-0.7.3/leaflet.css"/>
      <script src = "http://cdn.leafletjs.com/leaflet-0.7.3/leaflet.js"></script>
   </head>

   <body>
      <div id = "map" style = "width: 900px; height: 580px"></div>
      <script>
         // Creating map options
         var mapOptions = {
            center: [16.506174, 80.648015],
            zoom: 7
         }
         var map = new L.map('map', mapOptions);    // Creating a map object

         // Creating a Layer object
         var layer = new L.TileLayer('http://{s}.tile.openstreetmap.org/{z}/{x}/{y}.png');
         map.addLayer(layer); // Adding layer to the map

         map.on("click", function(e){
            new L.Marker([e.latlng.lat, e.latlng.lng]).addTo(map);
         })
      </script>
   </body>

</html>
It generates the following output −
LeafletJS - Overlays
Instead of map overlays, you can also use image, video overlays in a Leaflet application. In this chapter, we will see how to use such overlays.
Image Overlay
Follow the steps given below to use an image overlay.
Step 1 − Create a Map object by passing a <div> element (String or object) and map options (optional).
Step 2 − Create a Layer object by passing the URL of the desired tile.
Step 3 − Add the layer object to the map using the addLayer() method of the Map class.
Step 4 − Create the image overlay using L.imageOverlay(). Pass the URL of the image and an object representing image bounds, as shown below.
// Creating Image overlay
var imageUrl = 'tpPoster.jpg';
var imageBounds = [[17.342761, 78.552432], [16.396553, 80.727725]];
var overlay = L.imageOverlay(imageUrl, imageBounds);
Step 5 − Add the overlay to the map using addTo() method of the imageOverlay class, as shown below.
// Adding overlay to the map
overlay.addTo(map);
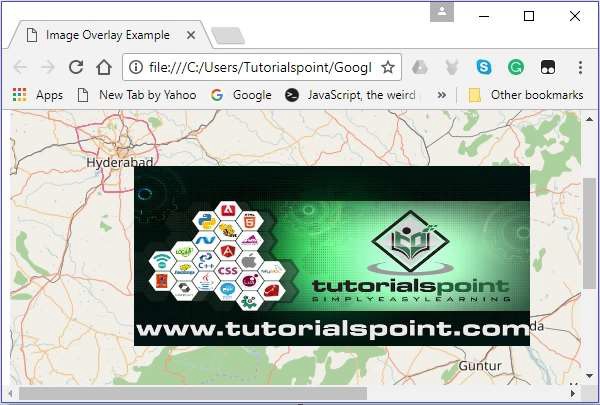
Example
The following code demonstrates the usage of image overlay.
<!DOCTYPE html>
<html>
   <head>
      <title>Image Overlay Example</title>
      <link rel = "stylesheet" href = "http://cdn.leafletjs.com/leaflet-0.7.3/leaflet.css"/>
      <script src = "http://cdn.leafletjs.com/leaflet-0.7.3/leaflet.js"></script>
   </head>

   <body>
      <div id = "map" style = "width:900px; height:580px"></div>
      <script>
         // Creating map options
         var mapOptions = {
            center: [17.342761, 78.552432],
            zoom: 8
         }
         var map = new L.map('map', mapOptions); // Creating a map object

         // Creating a Layer object
         var layer = new L.TileLayer('http://{s}.tile.openstreetmap.org/{z}/{x}/{y}.png');
         map.addLayer(layer);  // Adding layer to the map

         // Creating Image overlay
         var imageUrl = 'tpPoster.jpg';
         var imageBounds = [[17.342761, 78.552432], [16.396553, 80.727725]];
         var overlay = L.imageOverlay(imageUrl, imageBounds);
         overlay.addTo(map);
      </script>
   </body>

</html>
It generates the following output −
LeafletJS - Controls
Leaflet provides various controls such as zoom, attribution, scale, etc., where −
Zoom − By default, this control exists at the top left corner of the map. It has two buttons "+" and "–", using which you can zoom-in or zoom-out the map. You can remove the default zoom control by setting the zoomControl option of the map options to false.
Attribution − By default, this control exists at the bottom right corner of the map. It displays the attribution data in a small textbox. By default, it displays the text. You can remove the default attribution control by setting the attributionControl option of the map options to false.
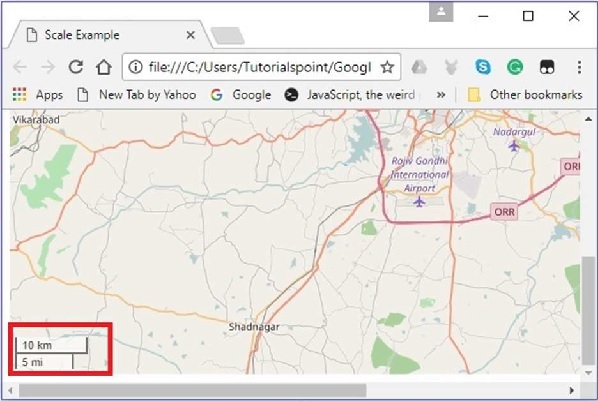
Scale − By default, this control exists at the bottom left corner of the map. It displays the current center of the screen.
In this chapter, we will explain how you can create and add all these three controls to your map using Leaflet JavaScript library.
Zoom
To add a zoom control of your own to the map using Leaflet JavaScript library, follow the steps given below −
Step 1 − Create a Map object by passing a element (String or object) and map options (optional).
Step 2 − Create a Layer object by passing the URL of the desired tile.
Step 3 − Add the layer object to the map using the addLayer() method of the Map class.
Step 4 − Create the zoomOptions variable and define your own text values for the zoom-in and zoom-out options, instead of the default ones (+ and -).
Then, create the zoom control by passing the zoomOptions variable to L.control.zoom() as shown below.
// zoom control options
var zoomOptions = {
   zoomInText: '1',
   zoomOutText: '0',
};
// Creating zoom control
var zoom = L.control.zoom(zoomOptions);
Step 5 − Add the zoom control object created in the previous step to the map using the addTo() method.
// Adding zoom control to the map
zoom.addTo(map);
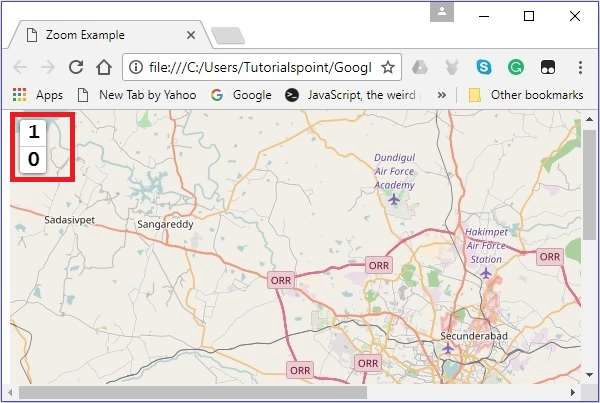
Example
Following is the code to add your own zoom control to your map, instead of the default one. Here, on pressing 1, the map zooms in, and on pressing 0, the map zooms out.
<!DOCTYPE html>
<html>
   <head>
      <title>Zoom Example</title>
      <link rel = "stylesheet" href = "http://cdn.leafletjs.com/leaflet-0.7.3/leaflet.css"/>
      <script src = "http://cdn.leafletjs.com/leaflet-0.7.3/leaflet.js"></script>
   </head>

   <body>
      <div id = "map" style = "width:900px; height:580px"></div>
      <script>
         // Creating map options
         var mapOptions = {
            center: [17.385044, 78.486671],
            zoom: 10,
            zoomControl: false
         }
         var map = new L.map('map', mapOptions); // Creating a map object

         // Creating a Layer object
         var layer = new L.TileLayer('http://{s}.tile.openstreetmap.org/{z}/{x}/{y}.png');
         map.addLayer(layer);   // Adding layer to the map

         // zoom control options
         var zoomOptions = {
            zoomInText: '1',
            zoomOutText: '0',
         };
         var zoom = L.control.zoom(zoomOptions);   // Creating zoom control
         zoom.addTo(map);   // Adding zoom control to the map
      </script>
   </body>

</html>
It generates the following output −
Attribution
To add an attribution of your own to the map using Leaflet JavaScript library, follow the steps given below −
Step 1 − Create a Map object by passing a <div> element (String or object) and map options (optional).
Step 2 − Create a Layer object by passing the URL of the desired tile.
Step 3 − Add the layer object to the map using the addLayer() method of the Map class.
Step 4 − Create the attrOptions variable and define your own prefix value instead of the default one (leaflet).
Then, create the attribution control by passing the attrOptions variable to L.control.attribution() as shown below.
// Attribution options
var attrOptions = {
   prefix: 'attribution sample'
};

// Creating an attribution
var attr = L.control.attribution(attrOptions);
Step 5 − Add the attribution control object created in the previous step to the map using the addTo() method.
// Adding attribution to the map
attr.addTo(map);
Example
The following code adds our own attribution control to your map, instead of the default one. Here, instead the text attribution sample will be displayed.
<!DOCTYPE html>
<html>
   <head>
      <title>Attribution Example</title>
      <link rel = "stylesheet" href = "http://cdn.leafletjs.com/leaflet-0.7.3/leaflet.css"/>
      <script src = "http://cdn.leafletjs.com/leaflet-0.7.3/leaflet.js"></script>
   </head>

   <body>
      <div id = "map" style = "width: 900px; height: 580px"></div>
      <script>
         // Creating map options
         var mapOptions = {
            center: [17.385044, 78.486671],
            zoom: 10,
            attributionControl: false
         }
         var map = new L.map('map', mapOptions); // Creating a map object

         // Creating a Layer object
         var layer = new L.TileLayer('http://{s}.tile.openstreetmap.org/{z}/{x}/{y}.png');
         map.addLayer(layer);    // Adding layer to the map

         // Attribution options
         var attrOptions = {
            prefix: 'attribution sample'
         };

         // Creating an attribution
         var attr = L.control.attribution(attrOptions);
         attr.addTo(map);  // Adding attribution to the map
      </script>
   </body>

</html>>
It generates the following output −
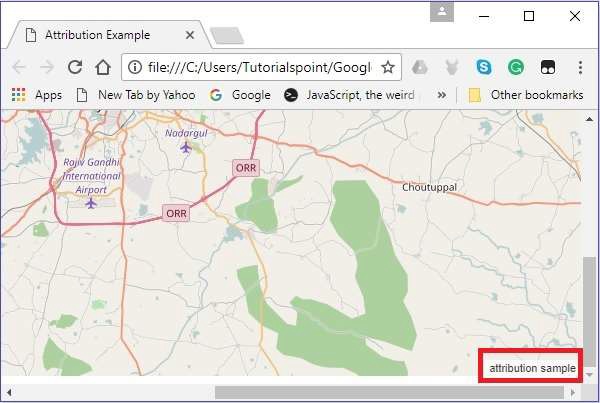
Scale
To add a scale control of your own to the map using Leaflet JavaScript library, follow the steps given below −
Step 1 − Create a Map object by passing a <div> element (String or object) and map options (optional).
Step 2 − Create a Layer object by passing the URL of the desired tile.
Step 3 − Add the layer object to the map using the addLayer() method of the Map class.
Step 4 − Create scale control by passing the using L.control.scale() as shown below.
// Creating scale control
var scale = L.control.scale();
Step 5 − Add the scale control object created in the previous step to the map using the addTo() method as shown below.
// Adding scale control to the map
scale.addTo(map);
Example
The following code adds scale control to your map.
<!DOCTYPE html>
<html>
   <head>
      <title>Scale Example</title>
      <link rel = "stylesheet" href = "http://cdn.leafletjs.com/leaflet-0.7.3/leaflet.css" />
      <script src = "http://cdn.leafletjs.com/leaflet-0.7.3/leaflet.js"></script>
   </head>

   <body>
      <div id = "map" style = "width:900px; height:580px"></div>
      <script>
         // Creating map options
         var mapOptions = {
            center: [17.385044, 78.486671],
            zoom: 10
         }
         // Creating a map object
         var map = new L.map('map', mapOptions);

         // Creating a Layer object
         var layer = new L.TileLayer('http://{s}.tile.openstreetmap.org/{z}/{x}/{y}.png');
         map.addLayer(layer); // Adding layer to the map
         var scale = L.control.scale(); // Creating scale control
         scale.addTo(map); // Adding scale control to the map
      </script>
   </body>

</html>
It generates the following output −