LeafletJS - Multi Polyline and Polygon
In the previous chapter, we learnt how to add various shapes such as circles, polygons, rectangles, polylines, etc. In this chapter, let us discuss how to add multi-polygons, multirectangles, and polylines.
Multi-Polyline
To draw a multi-polyline overlay on a map using Leaflet JavaScript library, follow the steps given below −
Step 1 − Create a Map object by passing a <div> element (String or object) and map options (optional).
Step 2 − Create a Layer object by passing the URL of the desired tile.
Step 3 − Add the layer object to the map using the addLayer() method of the Map class.
Step 4 − Create a latlangs variable to hold the points to draw the multi-polyline.
// Creating latlng object
var latlang = [
   [[17.385044, 78.486671], [16.506174, 80.648015], [17.686816, 83.218482]],
   [[13.082680, 80.270718], [12.971599, 77.594563],[15.828126, 78.037279]]
];
Step 5 − Create a multi-polyline using the L.multiPolyline() function. Pass the locations as variable to draw a multi-polyline and an option to specify the color and weight of the lines.
// Creating multi polyline options
var multiPolyLineOptions = {color:'red'};

// Creating multi polylines
var multipolyline = L.multiPolyline(latlang , multiPolyLineOptions);
Step 6 − Add multi-polyline to the map using the addTo() method of the Multipolyline class.
// Adding multi polyline to map
multipolyline.addTo(map);
Example
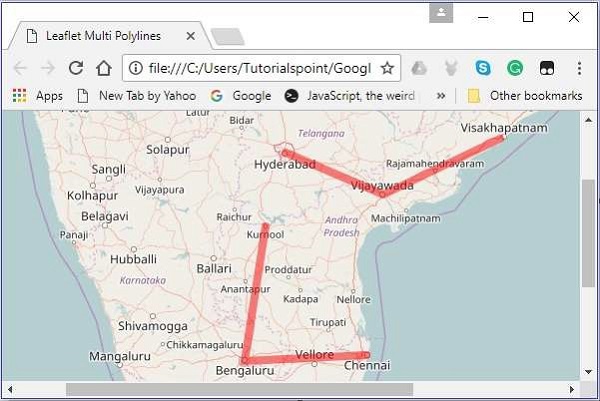
Following is the code to draw a multi-polyline covering the cities Hyderabad, Vijayawada, and Vishakhapatnam; and Kurnool, Bengaluru, and Chennai.
<!DOCTYPE html>
<html>
   <head>
      <title>Leaflet Multi Polylines</title>
      <link rel = "stylesheet" href = "http://cdn.leafletjs.com/leaflet-0.7.3/leaflet.css"/>
      <script src = "http://cdn.leafletjs.com/leaflet-0.7.3/leaflet.js"></script>
   </head>

   <body>
      <div id = "map" style = "width: 900px; height: 580px"></div>
      <script>
         // Creating map options
         var mapOptions = {
            center: [16.506174, 80.648015],
            zoom: 7
         }
         // Creating a map object
         var map = new L.map('map', mapOptions);

         // Creating a Layer object
         var layer = new L.TileLayer('http://{s}.tile.openstreetmap.org/{z}/{x}/{y}.png');

         // Adding layer to the map
         map.addLayer(layer);

         // Creating latlng object
         var latlang = [
            [[17.385044, 78.486671], [16.506174, 80.648015], [17.686816, 83.218482]],
            [[13.082680, 80.270718], [12.971599, 77.594563],[15.828126, 78.037279]]
         ];

         // Creating poly line options
         var multiPolyLineOptions = {color:'red'};

         // Creating multi poly-lines
         var multipolyline = L.multiPolyline(latlang , multiPolyLineOptions);

         // Adding multi poly-line to map
         multipolyline.addTo(map);
      </script>
   </body>

</html>
It generates the following output −
Multi Polygon
To draw a multi-polygon overlay on a map using Leaflet JavaScript library, follow the steps given below −
Step 1 − Create a Map object by passing a <div> element (String or object) and map options (optional).
Step 2 − Create a Layer object by passing the URL of the desired tile.
Step 3 − Add the layer object to the map using the addLayer() method of the Map class.
Step 4 − Create a latlangs variable to hold the points to draw the multi polygon.
// Creating latlng object
var latlang = [
   [[17.385044, 78.486671], [16.506174, 80.648015], [17.686816, 83.218482]],
   [[13.082680, 80.270718], [12.971599, 77.594563],[15.828126, 78.037279]]
];
Step 5 − Create a multi-polygon using the L.multiPolygon() function. Pass the locations as variable to draw the multi-polygon and an option to specify the color and weight of the lines.
// Creating multi polygon options
var multiPolygonOptions = {color:'red'};

// Creating multi polygon
var multipolygon = L.multiPolygon(latlang , multiPolygonOptions);
Step 6 − Add the multi-polygon to the map using the addTo() method of the MultiPolygon class.
// Adding multi polygon to map
multipolygon.addTo(map);
Example
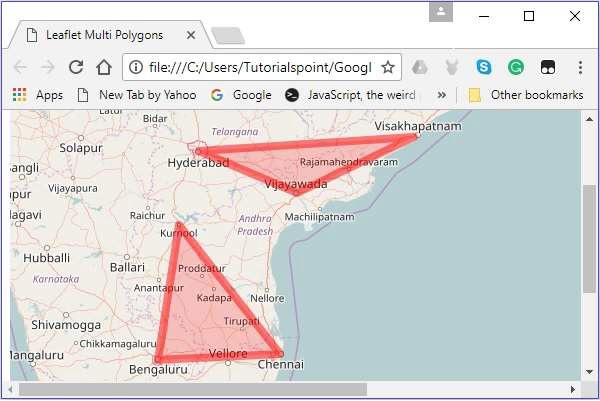
Following is the code to draw a multi-polygon touching the cities Hyderabad, Vijayawada, and Vishakhapatnam; and Kurnool, Bengaluru, and Chennai.
<!DOCTYPE html>
<html>
   <head>
      <title>Leaflet Multi Polygons</title>
      <link rel = "stylesheet" href = "http://cdn.leafletjs.com/leaflet-0.7.3/leaflet.css"/>
      <script src = "http://cdn.leafletjs.com/leaflet-0.7.3/leaflet.js"></script>
   </head>

   <body>
      <div id = "map" style = "width: 900px; height: 580px"></div>
      <script>
         // Creating map options
         var mapOptions = {
            center: [16.506174, 80.648015],
            zoom: 7
         }
         // Creating a map object
         var map = new L.map('map', mapOptions);

         // Creating a Layer object
         var layer = new L.TileLayer('http://{s}.tile.openstreetmap.org/{z}/{x}/{y}.png');

         // Adding layer to the map
         map.addLayer(layer);

         // Creating latlng object
         var latlang = [
            [[17.385044, 78.486671], [16.506174, 80.648015], [17.686816, 83.218482]],
            [[13.082680, 80.270718], [12.971599, 77.594563],[15.828126, 78.037279]]
         ];
         // Creating multi polygon options
         var multiPolygonOptions = {color:'red', weight:8};

         // Creating multi polygons
         var multipolygon = L.multiPolygon(latlang , multiPolygonOptions);

         // Adding multi polygon to map
         multipolygon.addTo(map);
      </script>
   </body>

</html>
It generates the following output −