LeafletJS - Getting Started
What is Leaflet.js
Leaflet.js is an open-source library using which we can deploy simple, interactive, lightweight web maps.
Leaflet JavaScript library allows you to use layers such as Tile layers, WMS, Markers, Popups, Vector layers (polylines, polygons, circles, etc.), Image overlays and GeoJSON.
You can interact with the Leaflet maps by dragging the map, zooming (by double click or, wheel scroll), using keyboard, using event handling, and by dragging the markers.
Leaflet supports browsers such as Chrome, Firefox, Safari 5+, Opera 12+, IE 711 on desktop and, browsers like Safari, Android, Chrome, Firefox for mobiles.
Steps to Load the Map on a Webpage
Follow the steps given below to load a map on your webpage −
Step 1: Create an HTML Page
Create a basic HTML page with head and body tags as shown below −
<!DOCTYPE html>
<html>
   <head>
   </head>

   <body>
      ...........
   </body>
</html>
Step 2 : Load the Leaflet CSS Script
Include the Leaflet CSS script in the example −
<head>
   <link rel = "stylesheet" href = "http://cdn.leafletjs.com/leaflet-0.7.3/leaflet.css" />
</head>
Step 3: Load the Leaflet Script
Load or include the Leaflet API using the script tag −
<head>
   <script src = "http://cdn.leafletjs.com/leaflet-0.7.3/leaflet.js"></script>
</head>
Step 4: Create the Container
To hold the map, we have to create a container element. Generally, the <div> tag (a generic container) is used for this purpose.
Create a container element and define its dimensions −
<div id = "sample" style = "width:900px; height:580px;"></div>
Step 5: Map Options
Leaflet provides several options such as types Control options, Interaction Options, Map State Options, Animation Options, etc. By setting values to these, we can customize the map as desired.
Create a mapOptions object (it is created just like a literal) and set values for the options center and zoom, where
center − As a value to this option, you need to pass a LatLng object specifying the location where we want to center the map. (Just specify the latitude and longitude values within [] braces)
zoom − As a value to this option, you need to pass an integer representing the zoom level of the map, as shown below.
var mapOptions = {
   center: [17.385044, 78.486671],
   zoom: 10
}
Step 6: Create a Map Object
Using the Map class of leaflet API, you can create a map on a page. You can create a map object by instantiating the called Map of the Leaflet API. While instantiating this class, you need to pass two parameters −
As a parameter to this option, you need to pass a String variable representing the DOM id or an instance of the <div> element. Here, the <div>element is an HTML container to hold the map.
An optional object literal with map options.
Create a Map object by passing the id of the <div> element and mapOptions object created in the previous step.
var map = new L.map('map', mapOptions);
Step 7: Creating the Layer Object
You can load and display various types of maps (tile layers) by instantiating the TileLayer class. While instantiating it you need to pass an URL template requesting the desired tile layer(map) from the service provider, in the form of a String variable.
Create the tile layer object as shown below.
var layer = new L.TileLayer('http://{s}.tile.openstreetmap.org/{z}/{x}/{y}.png');
Here we have used the openstreetmap.
Step 8: Add Layer to the Map
Finally add the layer created in the previous step to the map object using the addlayer() method as shown below.
map.addLayer(layer);
Example
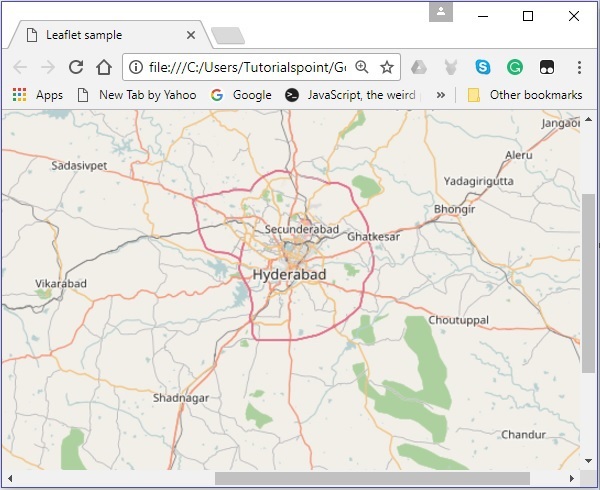
The following example shows how to load an open street map of Hyderabad city with a zoom value of 10.
<!DOCTYPE html>
<html>
   <head>
      <title>Leaflet sample</title>
      <link rel = "stylesheet" href = "http://cdn.leafletjs.com/leaflet-0.7.3/leaflet.css"/>
      <script src = "http://cdn.leafletjs.com/leaflet-0.7.3/leaflet.js"></script>
   </head>

   <body>
      <div id = "map" style = "width: 900px; height: 580px"></div>
      <script>
         // Creating map options
         var mapOptions = {
            center: [17.385044, 78.486671],
            zoom: 10
         }

         // Creating a map object
         var map = new L.map('map', mapOptions);

         // Creating a Layer object
         var layer = new L.TileLayer('http://{s}.tile.openstreetmap.org/{z}/{x}/{y}.png');

         // Adding layer to the map
         map.addLayer(layer);
      </script>
   </body>

</html>
It generates the following output −
Leaflet Map Providers
Just like open street map, you can load the layers of various service providers such as Open Topo, Thunder forest, Hydda, ESRI, Open weather, NASA GIBS, etc. To do so, you need to pass their respective URL while creating the TileLayer object
var layer = new L.TileLayer('URL of the required map');
The following table lists the URLs and their respective sample maps of the layers provided by Openstreetmap.
| Map Type | URL and Output |
|---|---|
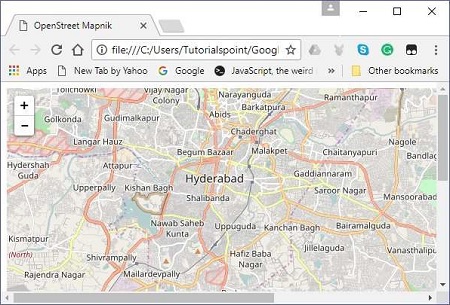
| Mapnik | http://{s}.tile.openstreetmap.org/{z}/{x}/{y}.png
|
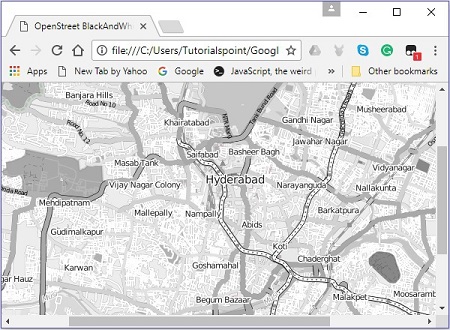
| Black And White | http://{s}.tiles.wmflabs.org/bw-mapnik/{z}/{x}/{y}.png
|
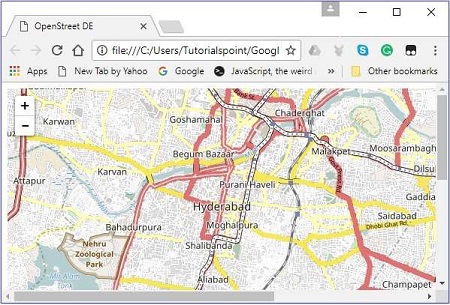
| DE | http://{s}.tile.openstreetmap.de/tiles/osmde/{z}/{x}/ {y}.png
|
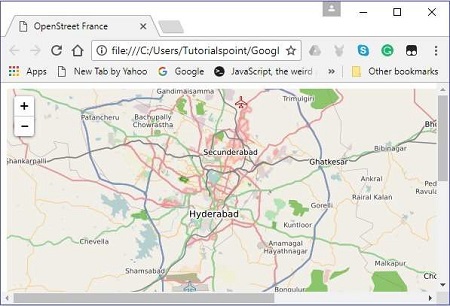
| France | http://{s}.tile.openstreetmap.fr/osmfr/{z}/{x}/{y}.png
|
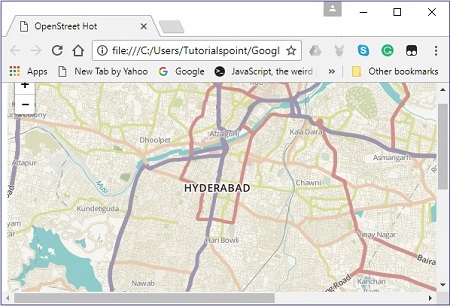
| Hot | http://{s}.tile.openstreetmap.fr/hot/{z}/{x}/{y}.png
|
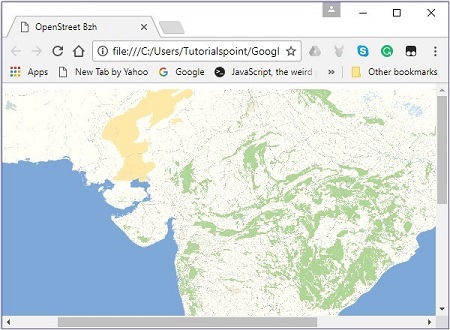
| BZH | http://tile.openstreetmap.bzh/br/{z}/{x}/{y}.png
|