- Seaborn - Home
- Seaborn - Introduction
- Seaborn - Environment Setup
- Importing Datasets and Libraries
- Seaborn - Figure Aesthetic
- Seaborn- Color Palette
- Seaborn - Histogram
- Seaborn - Kernel Density Estimates
- Visualizing Pairwise Relationship
- Seaborn - Plotting Categorical Data
- Distribution of Observations
- Seaborn - Statistical Estimation
- Seaborn - Plotting Wide Form Data
- Multi Panel Categorical Plots
- Seaborn - Linear Relationships
- Seaborn - Facet Grid
- Seaborn - Pair Grid
- Seaborn Useful Resources
- Seaborn - Quick Guide
- Seaborn - cheatsheet
- Seaborn - Useful Resources
- Seaborn - Discussion
Seaborn.set_hls_values() method
Seaborn.set_hls_values() method is used to saturate a color and then this saturated color is returned. In other words, the method independently manipulates the h, l and s channels of a color.
The h, l and s channels of color represent the hue, lightness and saturation components of an image. The hue depicts the color of the image, the saturation is the pureness of this color and the lightness is density of the hue.
Syntax
Following is the syntax of the seaborn.set_hls_values() method −
seaborn.set_hls_values(color,h=None,l=None,s=None)
Parameters
The parameters of this seaborn.set_hls_values() method are given below.
| S.No | Parameter and Description |
|---|---|
| 1 | color This parameter takes matplotlib color as input and the values include hex, rgb-tuple or an html color name. |
| 2 | h,l,s Tables floating values between 0 and 1 or a none values and determines the values for each channel respectively. |
Return value
The return value of this method is an rgb-tuple which contains the saturated color of the color passed.
Example 1
Now we will see how the method works by passing a color to it and also hue and saturation values rsanging bgetwen 1 and 0.
sns.set_hls_values("green",h=0.5,s=0.5)
Output
The output produced is as follows. An rgb tuple of the color after setting values to given values is given as output.
(0.12549019607843137, 0.37647058823529406, 0.3764705882352941)
Example 2
Example 2 In this example we will saturate another color and obtain the modified color. We can use the palplot method to visualize the rgb tuples sent by the set_hls_values() method.
The following line of code can be used to do so.
import seaborn as sns
import matplotlib.pyplot as plt
titanic=sns.load_dataset("titanic")
titanic.head()
# 1st example
#sns.set_hls_values("green",h=0.5,s=0.5)
# 2nd example
#sns.palplot(sns.set_hls_values("green",h=0.5,s=0.5,l=0.8))
# 3rd example
#sns.palplot(sns.set_hls_values("yellow",h=0.44,l=0.2,s=0.1))
plt.show()
Output
The output is as follows −
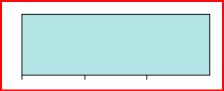
Example 3
We will use the palplot method to visualize a color after modfigying its hue, saturation and lightness. In this case, the color is purple. The below line of code was used to do so.
import seaborn as sns
import matplotlib.pyplot as plt
titanic=sns.load_dataset("titanic")
titanic.head()
sns.palplot(sns.set_hls_values("yellow",h=0.44,l=0.2,s=0.1))
plt.show()
Output
The output is as follows −