- Seaborn - Home
- Seaborn - Introduction
- Seaborn - Environment Setup
- Importing Datasets and Libraries
- Seaborn - Figure Aesthetic
- Seaborn- Color Palette
- Seaborn - Histogram
- Seaborn - Kernel Density Estimates
- Visualizing Pairwise Relationship
- Seaborn - Plotting Categorical Data
- Distribution of Observations
- Seaborn - Statistical Estimation
- Seaborn - Plotting Wide Form Data
- Multi Panel Categorical Plots
- Seaborn - Linear Relationships
- Seaborn - Facet Grid
- Seaborn - Pair Grid
- Seaborn Useful Resources
- Seaborn - Quick Guide
- Seaborn - cheatsheet
- Seaborn - Useful Resources
- Seaborn - Discussion
Seaborn - Multi Panel Categorical Plots
Categorical data can we visualized using two plots, you can either use the functions pointplot(), or the higher-level function factorplot().
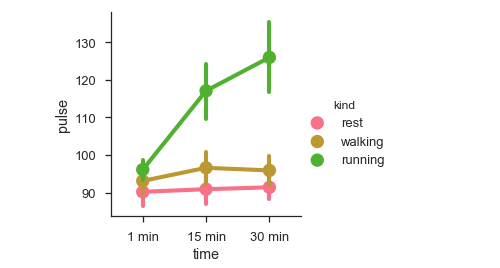
Factorplot
Factorplot draws a categorical plot on a FacetGrid. Using kind parameter we can choose the plot like boxplot, violinplot, barplot and stripplot. FacetGrid uses pointplot by default.
Example
import pandas as pd
import seaborn as sb
from matplotlib import pyplot as plt
df = sb.load_dataset('exercise')
sb.factorplot(x = "time", y = pulse", hue = "kind",data = df);
plt.show()
Output
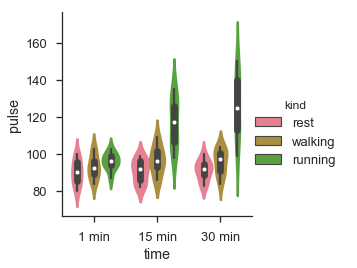
We can use different plot to visualize the same data using the kind parameter.
Example
import pandas as pd
import seaborn as sb
from matplotlib import pyplot as plt
df = sb.load_dataset('exercise')
sb.factorplot(x = "time", y = "pulse", hue = "kind", kind = 'violin',data = df);
plt.show()
Output
In factorplot, the data is plotted on a facet grid.
What is Facet Grid?
Facet grid forms a matrix of panels defined by row and column by dividing the variables. Due of panels, a single plot looks like multiple plots. It is very helpful to analyze all combinations in two discrete variables.
Let us visualize the above the definition with an example
Example
import pandas as pd
import seaborn as sb
from matplotlib import pyplot as plt
df = sb.load_dataset('exercise')
sb.factorplot(x = "time", y = "pulse", hue = "kind", kind = 'violin', col = "diet", data = df);
plt.show()
Output
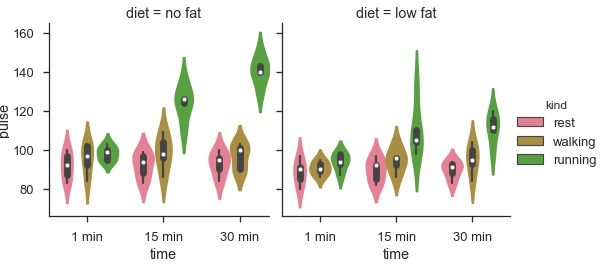
The advantage of using Facet is, we can input another variable into the plot. The above plot is divided into two plots based on a third variable called diet using the col parameter.
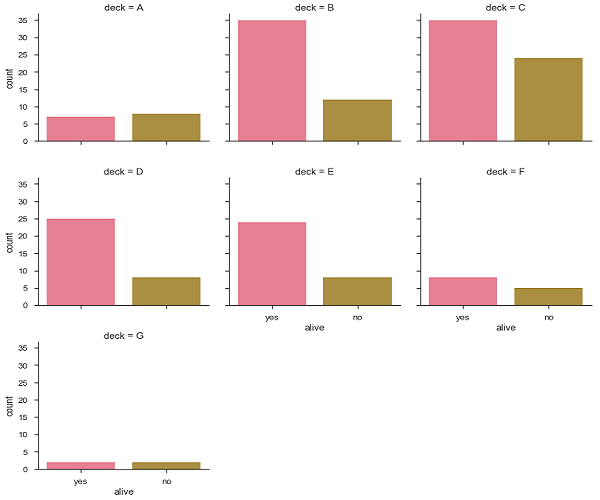
We can make many column facets and align them with the rows of the grid −
Example
import pandas as pd
import seaborn as sb
from matplotlib import pyplot as plt
df = sb.load_dataset('titanic')
sb.factorplot("alive", col = "deck", col_wrap = 3,data = df[df.deck.notnull()],kind = "count")
plt.show()
output