- Seaborn - Home
- Seaborn - Introduction
- Seaborn - Environment Setup
- Importing Datasets and Libraries
- Seaborn - Figure Aesthetic
- Seaborn- Color Palette
- Seaborn - Histogram
- Seaborn - Kernel Density Estimates
- Visualizing Pairwise Relationship
- Seaborn - Plotting Categorical Data
- Distribution of Observations
- Seaborn - Statistical Estimation
- Seaborn - Plotting Wide Form Data
- Multi Panel Categorical Plots
- Seaborn - Linear Relationships
- Seaborn - Facet Grid
- Seaborn - Pair Grid
- Seaborn Useful Resources
- Seaborn - Quick Guide
- Seaborn - cheatsheet
- Seaborn - Useful Resources
- Seaborn - Discussion
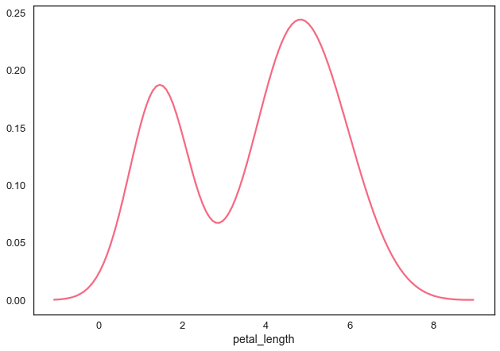
Seaborn - Kernel Density Estimates
Kernel Density Estimation (KDE) is a way to estimate the probability density function of a continuous random variable. It is used for non-parametric analysis.
Setting the hist flag to False in distplot will yield the kernel density estimation plot.
Example
import pandas as pd
import seaborn as sb
from matplotlib import pyplot as plt
df = sb.load_dataset('iris')
sb.distplot(df['petal_length'],hist=False)
plt.show()
Output
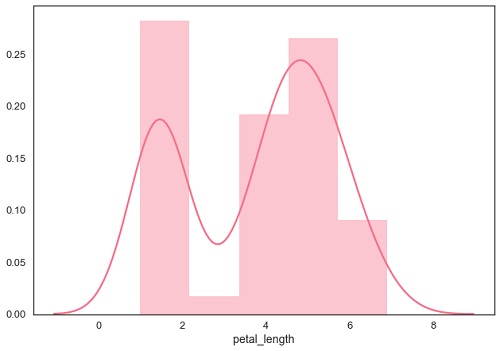
Fitting Parametric Distribution
distplot() is used to visualize the parametric distribution of a dataset.
Example
import pandas as pd
import seaborn as sb
from matplotlib import pyplot as plt
df = sb.load_dataset('iris')
sb.distplot(df['petal_length'])
plt.show()
Output
Plotting Bivariate Distribution
Bivariate Distribution is used to determine the relation between two variables. This mainly deals with relationship between two variables and how one variable is behaving with respect to the other.
The best way to analyze Bivariate Distribution in seaborn is by using the jointplot() function.
Jointplot creates a multi-panel figure that projects the bivariate relationship between two variables and also the univariate distribution of each variable on separate axes.
Scatter Plot
Scatter plot is the most convenient way to visualize the distribution where each observation is represented in two-dimensional plot via x and y axis.
Example
import pandas as pd
import seaborn as sb
from matplotlib import pyplot as plt
df = sb.load_dataset('iris')
sb.jointplot(x = 'petal_length',y = 'petal_width',data = df)
plt.show()
Output
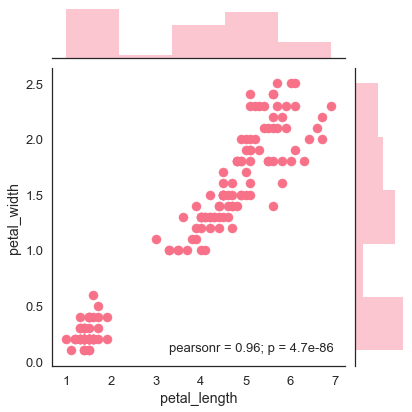
The above figure shows the relationship between the petal_length and petal_width in the Iris data. A trend in the plot says that positive correlation exists between the variables under study.
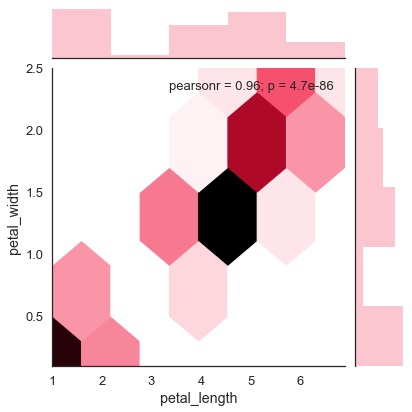
Hexbin Plot
Hexagonal binning is used in bivariate data analysis when the data is sparse in density i.e., when the data is very scattered and difficult to analyze through scatterplots.
An addition parameter called kind and value hex plots the hexbin plot.
Example
import pandas as pd
import seaborn as sb
from matplotlib import pyplot as plt
df = sb.load_dataset('iris')
sb.jointplot(x = 'petal_length',y = 'petal_width',data = df,kind = 'hex')
plt.show()
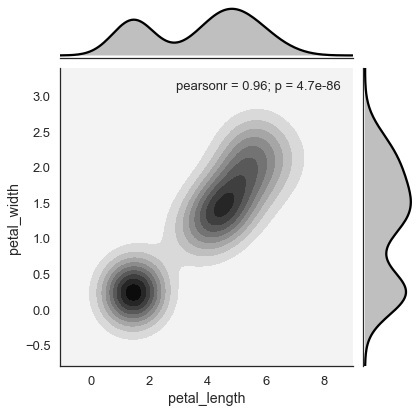
Kernel Density Estimation
Kernel density estimation is a non-parametric way to estimate the distribution of a variable. In seaborn, we can plot a kde using jointplot().
Pass value kde to the parameter kind to plot kernel plot.
Example
import pandas as pd
import seaborn as sb
from matplotlib import pyplot as plt
df = sb.load_dataset('iris')
sb.jointplot(x = 'petal_length',y = 'petal_width',data = df,kind = 'hex')
plt.show()
Output