- Seaborn - Home
- Seaborn - Introduction
- Seaborn - Environment Setup
- Importing Datasets and Libraries
- Seaborn - Figure Aesthetic
- Seaborn- Color Palette
- Seaborn - Histogram
- Seaborn - Kernel Density Estimates
- Visualizing Pairwise Relationship
- Seaborn - Plotting Categorical Data
- Distribution of Observations
- Seaborn - Statistical Estimation
- Seaborn - Plotting Wide Form Data
- Multi Panel Categorical Plots
- Seaborn - Linear Relationships
- Seaborn - Facet Grid
- Seaborn - Pair Grid
- Seaborn Useful Resources
- Seaborn - Quick Guide
- Seaborn - cheatsheet
- Seaborn - Useful Resources
- Seaborn - Discussion
Seaborn.hls_palette() method
Seaborn.hls_palette() method is used to get a set of evenly spaced colors that are a part of the HSL color space.
The HSL system contains images that are measured with hue, saturation and lightness. The hue represents the color of the image, the saturation is the amount of pureness in the color and the lightness is the strength in hue.
These hues are usually even spread along a curcular path. Therefore, the resulting palette will represent the categorical and cyclical data. The values of h, s and l must always lie in the range of 0 and 1.
Syntax
Following is the syntax of the hls_palette() method −
seaborn.hls_palette(n_colors=6, h=0.01, l=0.6, s=0.65, as_cmap=False)
Parameters
The parameters of the HLS palette method are described below.
| S.No | Parameter and Description |
|---|---|
| 1 | n_colors Number of colors in the cycle. |
| 2 | h Takes floating point numbers and is the first hue of the color cycle. |
| 3 | s Takes floating point value is the saturation of the colors. |
| 4 | l Takes floating point value and it is the lightness of the colors. |
Return value
It returns a list of RGB tuples a matplotlib colormap.
Example 1
In this example, we will understand the working of hls_palette() method. This method basically allows the user to create a custom palette by changing the hue, lightness and saturations of the colors.
To plot the custom created palette, palplot() method is used. This seaborn.palplot() method enables the user to plot a custom palette and see the pantones that are part of a particular palette. The difference between the color_palette and the palplto() method are that the color_palette() method plots the colors of the matplotlib palettes whereas the palplot() method is used to plot custom palettes.
import seaborn as sns
import matplotlib.pyplot as plt
titanic=sns.load_dataset("titanic")
titanic.head()
sns.palplot(sns.hls_palette(15))
plt.show()
Output
The output obtained is as follows −

Example 2
In this example, we will pass the hue value to the hls_paletee() method along with the n_colors value. Here, the hue value is set to 0.4 which is the value of the first hue in the custom series of colors.
import seaborn as sns
import matplotlib.pyplot as plt
titanic=sns.load_dataset("titanic")
titanic.head()
sns.palplot(sns.hls_palette(15,h=0.4))
plt.show()
Output
the output obtained is the following series of colors,

Example 3
Here, we will pass the saturation value along with the n-colors value to the method. The saturation is set to 0.2 in this example.
import seaborn as sns
import matplotlib.pyplot as plt
titanic=sns.load_dataset("titanic")
titanic.head()
#sns.palplot(sns.hls_palette(16, s=.2))
plt.show()
Output
the output produced is as follow,

Example 4
here, we will pass the lightness value along with the n_colors value to the method. The lightness is set to 0.5 in this example.
import seaborn as sns
import matplotlib.pyplot as plt
titanic=sns.load_dataset("titanic")
titanic.head()
sns.palplot(sns.hls_palette(11, l=.5))
plt.show()
Output
the output produced is as follows,

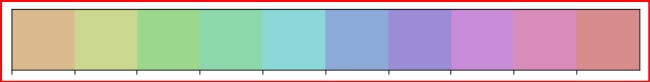
Example 5
Here, we will pass all the parameters to the hls_palette() method and later plot the colors.
import seaborn as sns
import matplotlib.pyplot as plt
titanic=sns.load_dataset("titanic")
titanic.head()
sns.palplot(sns.hls_palette(10, l=.7,s=.5,h=0.1))
plt.show()
Output
the output produced is as follows,