- qTest - Home
- qTest - Introduction
- qTest - Features
- qTest - Free Trial Access
- qTest - Login
- qTest - Dashboard
- qTest - Invite Users
- qTest - Add a Project
- Test Plan & Release Management
- Test Plan & Build Management
- qTest - Modules Management
- qTest - Requirements
- qTest - Create Associated Test Cases
- qTest - Import Requirements
- qTest - Export Requirements
- qTest - Export RTM
- qTest - Test Design
- qTest - Calling a Test Case
- qTest - Approve a Test Case
- qTest - Import Test Cases
- qTest - Export Test Cases
- qTest - Test Cycle Management
- qTest - Test Suite Management
- qTest - Add Test Runs
- qTest - Test Execution
- qTest - Quick Run
- qTest - Submit a Defect
- qTest - Clone a Defect
- qTest - Import a Defect
- qTest - Reports
- qTest - Filter
- qTest - Drag & Drop
- qTest - Hotkeys
- qTest - Recycle Bin
- qTest - Search
- qTest - Toggle ID
- qTest - Tagging ID
qTest - Reports
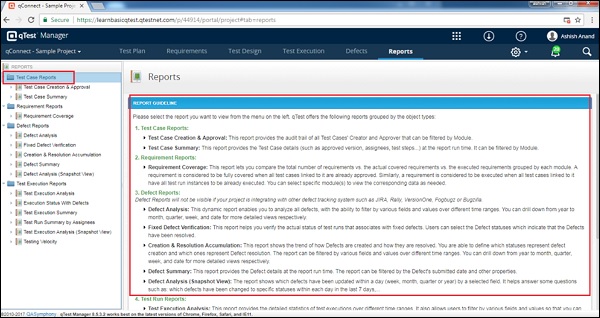
In the Reports module, you can create, view, and export reports supported by qTest. qTest supports a wide range of reports at all phases of STLC to better track the progress such as test execution, defect creation, requirements coverage, and test case creation. These reports contain various filters to fetch the most important information to prepare any of the metrics.
When you navigate to the Reports section, it displays a list of available reports for different activities on the left panel. On the right panel, qTest has a detailed description of each report as shown in the following screenshot.
Prepare Reports
In this section, we will learn how to prepare reports in qTest. Following are the steps −
Step 1 − To create a report, select the report name in the left panel. The following screenshot shows Execution Status with Defects is selected under the Test Execution Report. A set of filter options displays to narrow down the report. In this case, there is Module, Release, and Test Case Type filters.
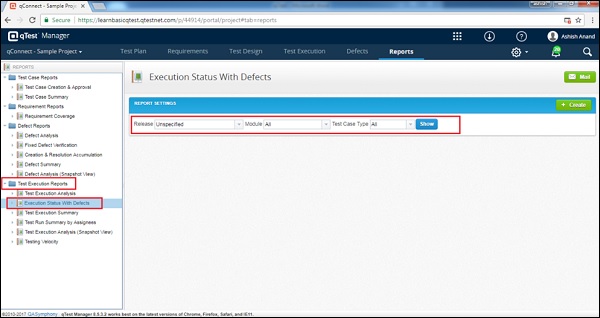
Step 2 − Select the options based on the available list in each filter. Click Show as in the above screenshot. It will generate the Reports in chart. It also displays the data in a tabular column.
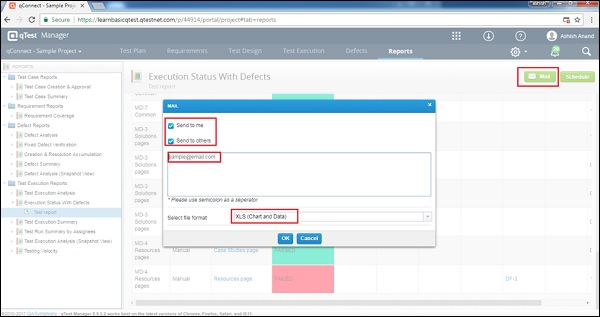
Step 3 − Email the report in XLS, CSV, or PDF format by clicking the Mail button at the top right corner of the screen. It displays a dialog box wherein, you can select Sent to others and type the email address and click OK.
The following screenshots display how to send reports in email.
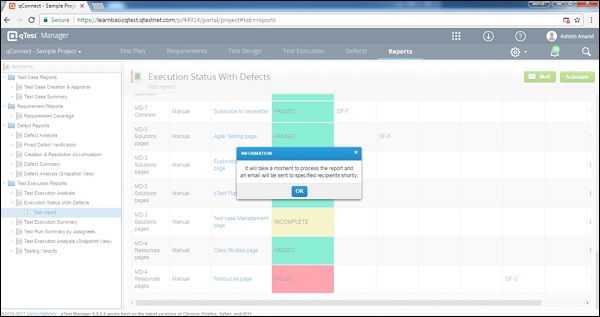
A dialog box appears providing information on the processing of the email request.
Similarly, any of the available reports can be generated. The first step is the selection of reports. The second step is to perform Reports setting with the available filter options and then click the Show button.
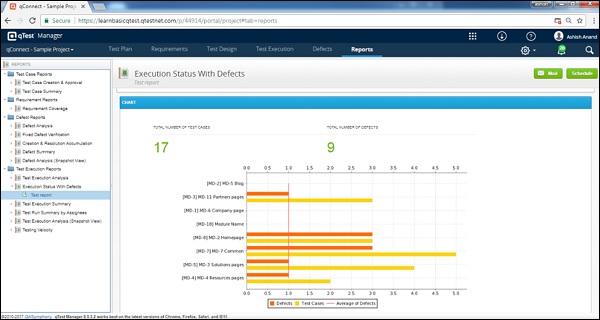
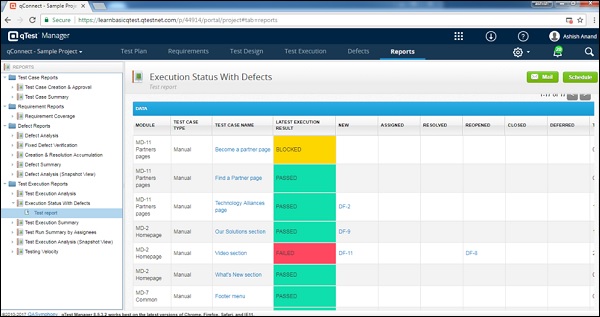
The Reports are generated in the three following parts −
- Latest information − It is statistic data.
- Chart − It may be a pie or tabular chart.
- Data Grid − Data used to prepare the report.