- Python Data Science - Home
- Python Data Science - Getting Started
- Python Data Science - Environment Setup
- Python Data Science - Pandas
- Python Data Science - Numpy
- Python Data Science - SciPy
- Python Data Science - Matplotlib
- Python Data Operations
- Python Data cleansing
- Python Processing CSV Data
- Python Processing JSON Data
- Python Processing XLS Data
- Python Relational databases
- Python NoSQL Databases
- Python Date and Time
- Python Data Wrangling
- Python Data Aggregation
- Python Reading HTML Pages
- Python Processing Unstructured Data
- Python word tokenization
- Python Stemming and Lemmatization
- Python Data Visualization
- Python Chart Properties
- Python Chart Styling
- Python Box Plots
- Python Heat Maps
- Python Scatter Plots
- Python Bubble Charts
- Python 3D Charts
- Python Time Series
- Python Geographical Data
- Python Graph Data
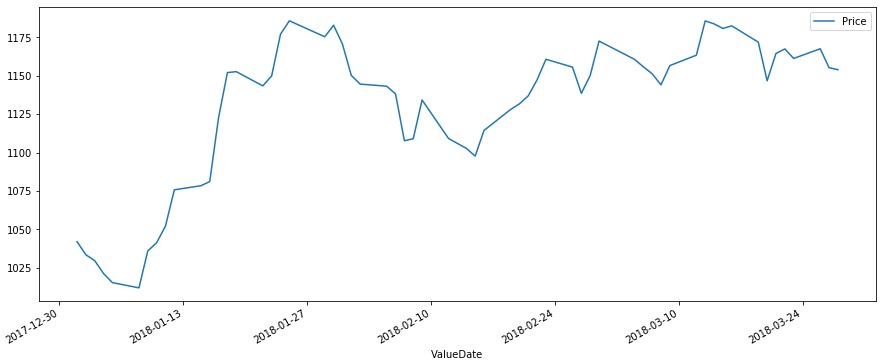
Python - Time Series
Time series is a series of data points in which each data point is associated with a timestamp. A simple example is the price of a stock in the stock market at different points of time on a given day. Another example is the amount of rainfall in a region at different months of the year.
In the below example we take the value of stock prices every day for a quarter for a particular stock symbol. We capture these values as a csv file and then organize them to a dataframe using pandas library. We then set the date field as index of the dataframe by recreating the additional Valuedate column as index and deleting the old valuedate column.
Sample Data
Below is the sample data for the price of the stock on different days of a given quarter. The data is saved in a file named as stock.csv
ValueDate	Price
01-01-2018,	1042.05
02-01-2018,	1033.55
03-01-2018,	1029.7
04-01-2018,	1021.3
05-01-2018,	1015.4
...
...
...
...
23-03-2018,	1161.3
26-03-2018,	1167.6
27-03-2018,	1155.25
28-03-2018,	1154
Creating Time Series
from datetime import datetime
import pandas as pd
import matplotlib.pyplot as plt

data = pd.read_csv('path_to_file/stock.csv')
df = pd.DataFrame(data, columns = ['ValueDate', 'Price'])

# Set the Date as Index
df['ValueDate'] = pd.to_datetime(df['ValueDate'])
df.index = df['ValueDate']
del df['ValueDate']


df.plot(figsize=(15, 6))
plt.show()
Its output is as follows −