- Python Data Science - Home
- Python Data Science - Getting Started
- Python Data Science - Environment Setup
- Python Data Science - Pandas
- Python Data Science - Numpy
- Python Data Science - SciPy
- Python Data Science - Matplotlib
- Python Data Operations
- Python Data cleansing
- Python Processing CSV Data
- Python Processing JSON Data
- Python Processing XLS Data
- Python Relational databases
- Python NoSQL Databases
- Python Date and Time
- Python Data Wrangling
- Python Data Aggregation
- Python Reading HTML Pages
- Python Processing Unstructured Data
- Python word tokenization
- Python Stemming and Lemmatization
- Python Data Visualization
- Python Chart Properties
- Python Chart Styling
- Python Box Plots
- Python Heat Maps
- Python Scatter Plots
- Python Bubble Charts
- Python 3D Charts
- Python Time Series
- Python Geographical Data
- Python Graph Data
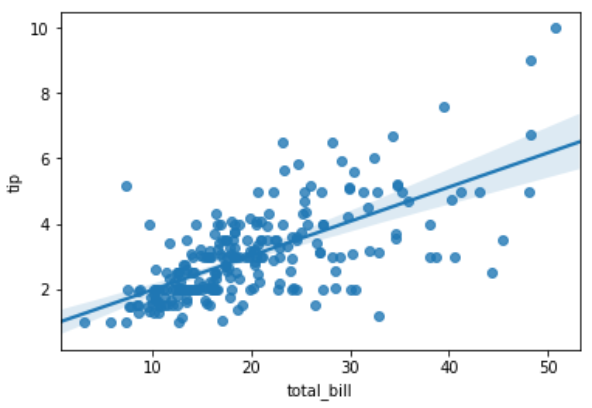
Python - Linear Regression
In Linear Regression these two variables are related through an equation, where exponent (power) of both these variables is 1. Mathematically a linear relationship represents a straight line when plotted as a graph. A non-linear relationship where the exponent of any variable is not equal to 1 creates a curve.
The functions in Seaborn to find the linear regression relationship is regplot. The below example shows its use.
import seaborn as sb
from matplotlib import pyplot as plt
df = sb.load_dataset('tips')
sb.regplot(x = "total_bill", y = "tip", data = df)
plt.show()
Its output is as follows −
Advertisements