- Python Data Science - Home
- Python Data Science - Getting Started
- Python Data Science - Environment Setup
- Python Data Science - Pandas
- Python Data Science - Numpy
- Python Data Science - SciPy
- Python Data Science - Matplotlib
- Python Data Operations
- Python Data cleansing
- Python Processing CSV Data
- Python Processing JSON Data
- Python Processing XLS Data
- Python Relational databases
- Python NoSQL Databases
- Python Date and Time
- Python Data Wrangling
- Python Data Aggregation
- Python Reading HTML Pages
- Python Processing Unstructured Data
- Python word tokenization
- Python Stemming and Lemmatization
- Python Data Visualization
- Python Chart Properties
- Python Chart Styling
- Python Box Plots
- Python Heat Maps
- Python Scatter Plots
- Python Bubble Charts
- Python 3D Charts
- Python Time Series
- Python Geographical Data
- Python Graph Data
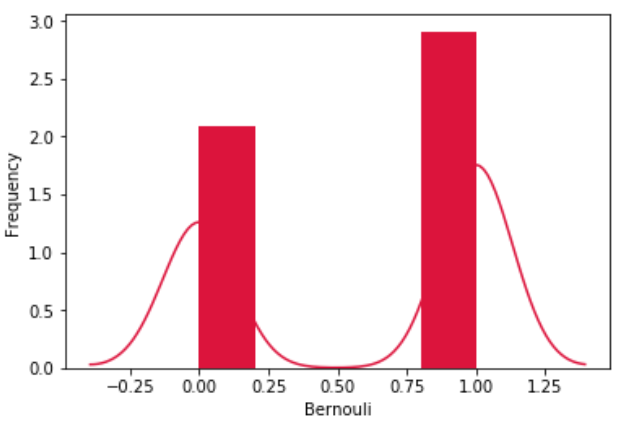
Python - Bernoulli Distribution
The Bernoulli distribution is a special case of the Binomial distribution where a single experiment is conducted so that the number of observation is 1. So, the Bernoulli distribution therefore describes events having exactly two outcomes.
We use various functions in numpy library to mathematically calculate the values for a bernoulli distribution. Histograms are created over which we plot the probability distribution curve.
from scipy.stats import bernoulli
import seaborn as sb

data_bern = bernoulli.rvs(size=1000,p=0.6)
ax = sb.distplot(data_bern,
                  kde=True,
                  color='crimson',
                  hist_kws={"linewidth": 25,'alpha':1})
ax.set(xlabel='Bernouli', ylabel='Frequency')
Its output is as follows −
Advertisements