- Python Data Science - Home
- Python Data Science - Getting Started
- Python Data Science - Environment Setup
- Python Data Science - Pandas
- Python Data Science - Numpy
- Python Data Science - SciPy
- Python Data Science - Matplotlib
- Python Data Operations
- Python Data cleansing
- Python Processing CSV Data
- Python Processing JSON Data
- Python Processing XLS Data
- Python Relational databases
- Python NoSQL Databases
- Python Date and Time
- Python Data Wrangling
- Python Data Aggregation
- Python Reading HTML Pages
- Python Processing Unstructured Data
- Python word tokenization
- Python Stemming and Lemmatization
- Python Data Visualization
- Python Chart Properties
- Python Chart Styling
- Python Box Plots
- Python Heat Maps
- Python Scatter Plots
- Python Bubble Charts
- Python 3D Charts
- Python Time Series
- Python Geographical Data
- Python Graph Data
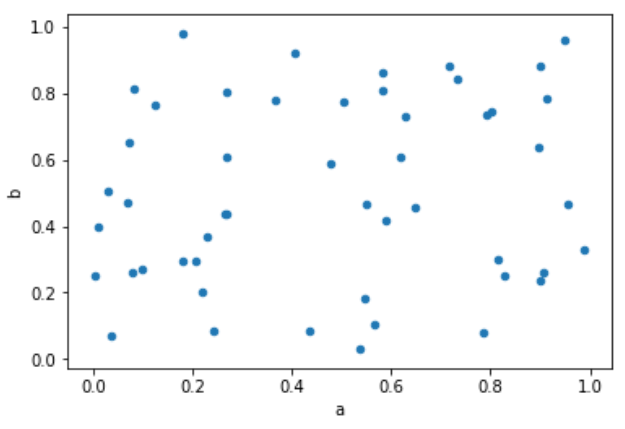
Python - Scatter Plots
Scatterplots show many points plotted in the Cartesian plane. Each point represents the values of two variables. One variable is chosen in the horizontal axis and another in the vertical axis.
Drawing a Scatter Plot
Scatter plot can be created using the DataFrame.plot.scatter() methods.
import pandas as pd
import numpy as np
df = pd.DataFrame(np.random.rand(50, 4), columns=['a', 'b', 'c', 'd'])
df.plot.scatter(x='a', y='b')
Its output is as follows −
Advertisements