- Python Data Science - Home
- Python Data Science - Getting Started
- Python Data Science - Environment Setup
- Python Data Science - Pandas
- Python Data Science - Numpy
- Python Data Science - SciPy
- Python Data Science - Matplotlib
- Python Data Operations
- Python Data cleansing
- Python Processing CSV Data
- Python Processing JSON Data
- Python Processing XLS Data
- Python Relational databases
- Python NoSQL Databases
- Python Date and Time
- Python Data Wrangling
- Python Data Aggregation
- Python Reading HTML Pages
- Python Processing Unstructured Data
- Python word tokenization
- Python Stemming and Lemmatization
- Python Data Visualization
- Python Chart Properties
- Python Chart Styling
- Python Box Plots
- Python Heat Maps
- Python Scatter Plots
- Python Bubble Charts
- Python 3D Charts
- Python Time Series
- Python Geographical Data
- Python Graph Data
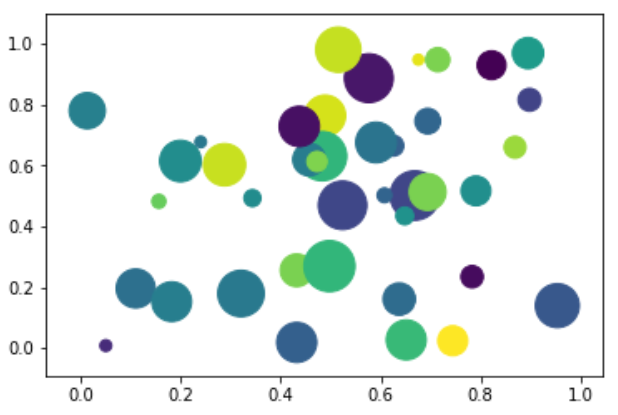
Python - Bubble Charts
Bubble charts display data as a cluster of circles. The required data to create bubble chart needs to have the xy coordinates, size of the bubble and the colour of the bubbles. The colours can be supplied by the library itself.
Drawing a Bubble Chart
Bubble chart can be created using the DataFrame.plot.scatter() methods.
import matplotlib.pyplot as plt
import numpy as np

# create data
x = np.random.rand(40)
y = np.random.rand(40)
z = np.random.rand(40)
colors = np.random.rand(40)
# use the scatter function
plt.scatter(x, y, s=z*1000,c=colors)
plt.show()
Its output is as follows −
Advertisements