- MATLAB - Home
- MATLAB - Overview
- MATLAB - Features
- MATLAB - Environment Setup
- MATLAB - Editors
- MATLAB - Online
- MATLAB - Workspace
- MATLAB - Syntax
- MATLAB - Variables
- MATLAB - Commands
- MATLAB - Data Types
- MATLAB - Operators
- MATLAB - Dates and Time
- MATLAB - Numbers
- MATLAB - Random Numbers
- MATLAB - Strings and Characters
- MATLAB - Text Formatting
- MATLAB - Timetables
- MATLAB - M-Files
- MATLAB - Colon Notation
- MATLAB - Data Import
- MATLAB - Data Output
- MATLAB - Normalize Data
- MATLAB - Predefined Variables
- MATLAB - Decision Making
- MATLAB - Decisions
- MATLAB - If End Statement
- MATLAB - If Else Statement
- MATLAB - If…Elseif Else Statement
- MATLAB - Nest If Statememt
- MATLAB - Switch Statement
- MATLAB - Nested Switch
- MATLAB - Loops
- MATLAB - Loops
- MATLAB - For Loop
- MATLAB - While Loop
- MATLAB - Nested Loops
- MATLAB - Break Statement
- MATLAB - Continue Statement
- MATLAB - End Statement
- MATLAB - Arrays
- MATLAB - Arrays
- MATLAB - Vectors
- MATLAB - Transpose Operator
- MATLAB - Array Indexing
- MATLAB - Multi-Dimensional Array
- MATLAB - Compatible Arrays
- MATLAB - Categorical Arrays
- MATLAB - Cell Arrays
- MATLAB - Matrix
- MATLAB - Sparse Matrix
- MATLAB - Tables
- MATLAB - Structures
- MATLAB - Array Multiplication
- MATLAB - Array Division
- MATLAB - Array Functions
- MATLAB - Functions
- MATLAB - Functions
- MATLAB - Function Arguments
- MATLAB - Anonymous Functions
- MATLAB - Nested Functions
- MATLAB - Return Statement
- MATLAB - Void Function
- MATLAB - Local Functions
- MATLAB - Global Variables
- MATLAB - Function Handles
- MATLAB - Filter Function
- MATLAB - Factorial
- MATLAB - Private Functions
- MATLAB - Sub-functions
- MATLAB - Recursive Functions
- MATLAB - Function Precedence Order
- MATLAB - Map Function
- MATLAB - Mean Function
- MATLAB - End Function
- MATLAB - Error Handling
- MATLAB - Error Handling
- MATLAB - Try...Catch statement
- MATLAB - Debugging
- MATLAB - Plotting
- MATLAB - Plotting
- MATLAB - Plot Arrays
- MATLAB - Plot Vectors
- MATLAB - Bar Graph
- MATLAB - Histograms
- MATLAB - Graphics
- MATLAB - 2D Line Plot
- MATLAB - 3D Plots
- MATLAB - Formatting a Plot
- MATLAB - Logarithmic Axes Plots
- MATLAB - Plotting Error Bars
- MATLAB - Plot a 3D Contour
- MATLAB - Polar Plots
- MATLAB - Scatter Plots
- MATLAB - Plot Expression or Function
- MATLAB - Draw Rectangle
- MATLAB - Plot Spectrogram
- MATLAB - Plot Mesh Surface
- MATLAB - Plot Sine Wave
- MATLAB - Interpolation
- MATLAB - Interpolation
- MATLAB - Linear Interpolation
- MATLAB - 2D Array Interpolation
- MATLAB - 3D Array Interpolation
- MATLAB - Polynomials
- MATLAB - Polynomials
- MATLAB - Polynomial Addition
- MATLAB - Polynomial Multiplication
- MATLAB - Polynomial Division
- MATLAB - Derivatives of Polynomials
- MATLAB - Transformation
- MATLAB - Transforms
- MATLAB - Laplace Transform
- MATLAB - Laplacian Filter
- MATLAB - Laplacian of Gaussian Filter
- MATLAB - Inverse Fourier transform
- MATLAB - Fourier Transform
- MATLAB - Fast Fourier Transform
- MATLAB - 2-D Inverse Cosine Transform
- MATLAB - Add Legend to Axes
- MATLAB - Object Oriented
- MATLAB - Object Oriented Programming
- MATLAB - Classes and Object
- MATLAB - Functions Overloading
- MATLAB - Operator Overloading
- MATLAB - User-Defined Classes
- MATLAB - Copy Objects
- MATLAB - Algebra
- MATLAB - Linear Algebra
- MATLAB - Gauss Elimination
- MATLAB - Gauss-Jordan Elimination
- MATLAB - Reduced Row Echelon Form
- MATLAB - Eigenvalues and Eigenvectors
- MATLAB - Integration
- MATLAB - Integration
- MATLAB - Double Integral
- MATLAB - Trapezoidal Rule
- MATLAB - Simpson's Rule
- MATLAB - Miscellenous
- MATLAB - Calculus
- MATLAB - Differential
- MATLAB - Inverse of Matrix
- MATLAB - GNU Octave
- MATLAB - Simulink
MATLAB - Plot Vectors
In MATLAB, vectors are fundamental data structures used to store and manipulate sequences of elements. They represent one-dimensional arrays that can contain numbers, characters, logical values, or other MATLAB objects.
Vectors in MATLAB can be created in several ways −
- Row Vectors − Created using square brackets with elements separated by spaces or commas. For example: v = [1, 2, 3, 4].
- Column Vectors − Similar to row vectors, but elements are separated by semicolons to create a column. For example: v = [1; 2; 3; 4].
- Using Functions − MATLAB functions like linspace, ones, zeros, and rand can generate vectors with specific characteristics (e.g., a range of values, all ones, all zeros, random values).
Vectors in MATLAB allow for various operations such as addition, subtraction, element-wise multiplication, division, and more. They play a crucial role in mathematical computations, signal processing, data analysis, and plotting within MATLAB.
Create a Matlab Vector
It is very easy to create matlab vectors, an example of row vector and column vector is as follows −
% Row vector with elements 1, 2, 3, 4
row_vector = [1, 2, 3, 4];

% Column vector with elements 5, 6, 7, 8
column_vector = [5; 6; 7; 8];
Let us make use of functions to create vectors as shown below −
% Creates a row vector of 10 linearly spaced points from 0 to 1
linear_vector = linspace(0, 1, 10);

% Row vector of 5 ones
ones_vector = ones(1, 5);

% Column vector of 4 zeros
zeros_vector = zeros(4, 1);
The functions used are linspace(), ones() and zeros().
Plotting Vectors in Matlab
Plotting of vectors in Matlab can be done using the function quiver().
Syntax
quiver(X,Y,U,V)
quiver(U,V)
quiver(___,scale)
quiver(___,LineSpec)
Let us understand each of the syntax in detail.
quiver(X,Y,U,V) − The function quiver(X,Y,U,V) in MATLAB generates arrow plots using directional components U and V at specific Cartesian coordinates X and Y. For instance, each arrow begins at the coordinates X(1), Y(1), stretches horizontally based on U(1), and vertically based on V(1). By default, quiver automatically adjusts the arrow lengths to prevent overlap.
quiver(U,V) − The function quiver(U,V) in MATLAB generates arrow plots using directional components U and V at evenly distributed positions.When U and V are vectors, the arrows' x-coordinates span from 1 to the number of elements in U and V, while their y-coordinates are all set to 1.If U and V are matrices, the arrows' x-coordinates span from 1 to the number of columns in U and V, and their y-coordinates range from 1 to the number of rows in U and V.
quiver(___,scale) − The quiver(___, scale) function in MATLAB modifies the arrow lengths in the following ways −
- If scale is a positive value, the function automatically resizes the arrows to prevent overlap, then scales them by the factor specified. For instance, a scale of 2 doubles the arrow lengths, while 0.5 reduces them by half.
- When scale is set to 'off' or 0 (e.g., quiver(X,Y,U,V,'off')), automatic scaling is deactivated, disabling the automatic adjustment of arrow lengths.
quiver(___,LineSpec) − The quiver(___, LineSpec) function configures the line style, marker, and color for the plot. Markers are positioned at the coordinates specified by X and Y. When a marker is specified using LineSpec, arrowheads are not displayed. To show arrowheads along with a marker, it's preferable to set the Marker property separately.
Examples of Vector Plotting
Here are some examples of vector plotting −
Example 1
In this example X and Y represent the coordinates where the arrows start.
U and V denote the directional components, with U determining the horizontal length and V determining the vertical length of the arrows.
% Define coordinates and directional components
X = [1, 2, 3]; % X-coordinates
Y = [1, 1, 1]; % Y-coordinates
U = [2, -1, 3]; % Horizontal components
V = [3, 1, -2]; % Vertical components

% Plotting arrows using quiver

quiver(X, Y, U, V);

% Setting plot properties
xlabel('X-axis');
ylabel('Y-axis');
title('Arrow Plot using quiver');
Let us execute the code and check the output −
Example 2
In this example U_vector and V_vector represent the directional components along the x-axis and y-axis, respectively.
Since both U_vector and V_vector are vectors, the x-coordinates of the arrows will span from 1 to the number of elements in the vectors, while the y-coordinates will be set to 1 for all arrows.
% Creating vectors U and V
U_vector = [1, 2, 3, 4]; % Directional components for x-axis
V_vector = [2, 1, 3, 2]; % Directional components for y-axis

% Plotting arrows using quiver with vectors
quiver(U_vector, V_vector);

% Setting plot properties
xlabel('X-axis');
ylabel('Y-axis');
title('Arrow Plot using quiver with Vectors');
On execution the output is as follows −
Example 3
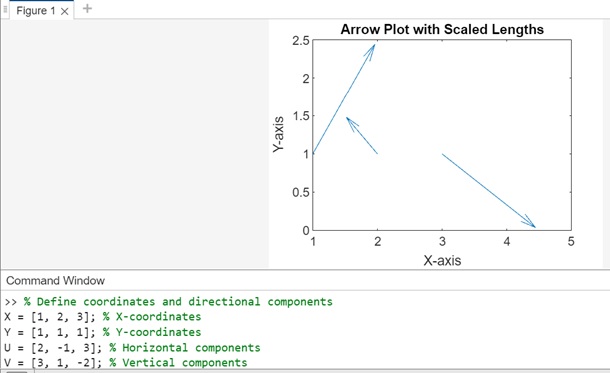
Scaling the graph with positive value. In this example, X, Y, U, and V define the coordinates and directional components.The quiver function is used with a scale factor of 1.5, which automatically adjusts and scales the arrow lengths.
% Define coordinates and directional components
X = [1, 2, 3]; % X-coordinates
Y = [1, 1, 1]; % Y-coordinates
U = [2, -1, 3]; % Horizontal components
V = [3, 1, -2]; % Vertical components

% Plotting arrows with automatic scaling by a factor of 1.5

quiver(X, Y, U, V, 1.5);

% Setting plot properties
xlabel('X-axis');
ylabel('Y-axis');
title('Arrow Plot with Scaled Lengths');
On execution the output is −
Example 4
This example will demonstrate the use of Linespec. So X, Y, U, and V define the coordinates and directional components. The quiver() function is used with the LineSpec argument 'ro', which sets red circles as markers at specified coordinates without displaying arrowheads.
% Define coordinates and directional components
X = [1, 2, 3]; % X-coordinates
Y = [1, 1, 1]; % Y-coordinates
U = [2, -1, 3]; % Horizontal components
V = [3, 1, -2]; % Vertical components

% Plotting arrows with LineSpec to show markers without arrowheads
quiver(X, Y, U, V, 'ro'); % 'ro' sets red color and circles as markers

% Setting plot properties
xlabel('X-axis');
ylabel('Y-axis');
title('Arrow Plot with Markers using LineSpec');
The output on execution is −