- MATLAB - Home
- MATLAB - Overview
- MATLAB - Features
- MATLAB - Environment Setup
- MATLAB - Editors
- MATLAB - Online
- MATLAB - Workspace
- MATLAB - Syntax
- MATLAB - Variables
- MATLAB - Commands
- MATLAB - Data Types
- MATLAB - Operators
- MATLAB - Dates and Time
- MATLAB - Numbers
- MATLAB - Random Numbers
- MATLAB - Strings and Characters
- MATLAB - Text Formatting
- MATLAB - Timetables
- MATLAB - M-Files
- MATLAB - Colon Notation
- MATLAB - Data Import
- MATLAB - Data Output
- MATLAB - Normalize Data
- MATLAB - Predefined Variables
- MATLAB - Decision Making
- MATLAB - Decisions
- MATLAB - If End Statement
- MATLAB - If Else Statement
- MATLAB - If…Elseif Else Statement
- MATLAB - Nest If Statememt
- MATLAB - Switch Statement
- MATLAB - Nested Switch
- MATLAB - Loops
- MATLAB - Loops
- MATLAB - For Loop
- MATLAB - While Loop
- MATLAB - Nested Loops
- MATLAB - Break Statement
- MATLAB - Continue Statement
- MATLAB - End Statement
- MATLAB - Arrays
- MATLAB - Arrays
- MATLAB - Vectors
- MATLAB - Transpose Operator
- MATLAB - Array Indexing
- MATLAB - Multi-Dimensional Array
- MATLAB - Compatible Arrays
- MATLAB - Categorical Arrays
- MATLAB - Cell Arrays
- MATLAB - Matrix
- MATLAB - Sparse Matrix
- MATLAB - Tables
- MATLAB - Structures
- MATLAB - Array Multiplication
- MATLAB - Array Division
- MATLAB - Array Functions
- MATLAB - Functions
- MATLAB - Functions
- MATLAB - Function Arguments
- MATLAB - Anonymous Functions
- MATLAB - Nested Functions
- MATLAB - Return Statement
- MATLAB - Void Function
- MATLAB - Local Functions
- MATLAB - Global Variables
- MATLAB - Function Handles
- MATLAB - Filter Function
- MATLAB - Factorial
- MATLAB - Private Functions
- MATLAB - Sub-functions
- MATLAB - Recursive Functions
- MATLAB - Function Precedence Order
- MATLAB - Map Function
- MATLAB - Mean Function
- MATLAB - End Function
- MATLAB - Error Handling
- MATLAB - Error Handling
- MATLAB - Try...Catch statement
- MATLAB - Debugging
- MATLAB - Plotting
- MATLAB - Plotting
- MATLAB - Plot Arrays
- MATLAB - Plot Vectors
- MATLAB - Bar Graph
- MATLAB - Histograms
- MATLAB - Graphics
- MATLAB - 2D Line Plot
- MATLAB - 3D Plots
- MATLAB - Formatting a Plot
- MATLAB - Logarithmic Axes Plots
- MATLAB - Plotting Error Bars
- MATLAB - Plot a 3D Contour
- MATLAB - Polar Plots
- MATLAB - Scatter Plots
- MATLAB - Plot Expression or Function
- MATLAB - Draw Rectangle
- MATLAB - Plot Spectrogram
- MATLAB - Plot Mesh Surface
- MATLAB - Plot Sine Wave
- MATLAB - Interpolation
- MATLAB - Interpolation
- MATLAB - Linear Interpolation
- MATLAB - 2D Array Interpolation
- MATLAB - 3D Array Interpolation
- MATLAB - Polynomials
- MATLAB - Polynomials
- MATLAB - Polynomial Addition
- MATLAB - Polynomial Multiplication
- MATLAB - Polynomial Division
- MATLAB - Derivatives of Polynomials
- MATLAB - Transformation
- MATLAB - Transforms
- MATLAB - Laplace Transform
- MATLAB - Laplacian Filter
- MATLAB - Laplacian of Gaussian Filter
- MATLAB - Inverse Fourier transform
- MATLAB - Fourier Transform
- MATLAB - Fast Fourier Transform
- MATLAB - 2-D Inverse Cosine Transform
- MATLAB - Add Legend to Axes
- MATLAB - Object Oriented
- MATLAB - Object Oriented Programming
- MATLAB - Classes and Object
- MATLAB - Functions Overloading
- MATLAB - Operator Overloading
- MATLAB - User-Defined Classes
- MATLAB - Copy Objects
- MATLAB - Algebra
- MATLAB - Linear Algebra
- MATLAB - Gauss Elimination
- MATLAB - Gauss-Jordan Elimination
- MATLAB - Reduced Row Echelon Form
- MATLAB - Eigenvalues and Eigenvectors
- MATLAB - Integration
- MATLAB - Integration
- MATLAB - Double Integral
- MATLAB - Trapezoidal Rule
- MATLAB - Simpson's Rule
- MATLAB - Miscellenous
- MATLAB - Calculus
- MATLAB - Differential
- MATLAB - Inverse of Matrix
- MATLAB - GNU Octave
- MATLAB - Simulink
MATLAB - Draw Rectangle
In MATLAB, you can draw rectangles using the rectangle function, which allows you to specify the position, size, and appearance of the rectangle. Rectangles are commonly used in MATLAB for visualizations, annotations, and highlighting areas of interest in plots or images.
Syntax
rectangle('Position',pos)
rectangle('Position',pos,'Curvature',cur)
rectangle(___,Name,Value)
rectangle(ax,___)
r = rectangle(___)
Here is an explanation for each of the syntax we mentioned above −
rectangle('Position',pos)
Function draws a rectangle in a 2-D plot. You use a four-numbered vector pos like [x y w h] to specify its location and size. The x and y values set where the rectangle starts, while w and h set its width and height. This function adds the rectangle to the current plot without erasing anything already there.
rectangle('Position',pos,'Curvature',cur)
Function lets you make rectangles with curved sides. To control the curve, use the cur parameter. If you want different curves for horizontal and vertical sides, use a two-numbered vector like [horizontal vertical]. For the same curve on all sides, use a single number. The value ranges from 0 (no curve) to 1 (full curve). Use [1 1] to make a circle or ellipse.
rectangle(___,Name,Value)
Here you're adding more details to the rectangle using settings like 'FaceColor', 'red' to give it a red color. You can mix and match these settings with the other ways you draw rectangles.
rectangle(ax,___)
When you use rectangle(ax,___), here you want to draw the rectangle in a specific set of axes, ax, instead of the default current set of axes. You can use this option with any of the other ways you draw rectangles.
r = rectangle(___)
Using r = rectangle(___), creates a rectangle and stores it in the variable r. You can use r to change the rectangle's properties after you've created it. This works with any of the ways you draw rectangles.
Rectangle Properties
Rectangle properties are settings that determine how a rectangle looks and behaves. You can change these properties to adjust various aspects of the rectangle's appearance. To work with properties, you use dot notation, which involves using a dot (.) followed by the property name.
For example, if you create a rectangle object h using rectangle, you can access and modify its properties. Here's how you might change the FaceColor property of the rectangle −
h = rectangle;       % Create a rectangle
currentColor = h.FaceColor;   % Get the current face color
h.FaceColor = 'blue';         % Set the face color to blue
In this example, h.FaceColor retrieves the current face color of the rectangle, and h.FaceColor = 'blue' sets the face color to blue. You can explore other properties like EdgeColor, Position, Curvature, and many more to customize your rectangle further.
Color and Styling Properties
| Sr.No | Property & Description | Values Used |
|---|---|---|
| 1 | FaceColor The FaceColor property of a rectangle determines the color of the rectangle's interior. |
You can use variety of colors the predefined color names (red, green,blue) or RGB values ([R G B]) |
| 2 | EdgeColor EdgeColor refers to the color of the edges of an object, such as a shape or text. You can specify the outline color using different formats like RGB values, hexadecimal codes, or color names. The default outline color is black, which is represented by [0 0 0] in RGB format. |
You can set the outline color using different formats, such as RGB values, hexadecimal codes, or color names like 'r', 'g', or 'b'. The default outline color is black, represented as [0 0 0]. |
| 3 | EdgeColorMode Control how the EdgeColor property is set. |
Values taken are auto and manual. |
| 4 | FaceAlpha The transparency of the fill color is set using a number between 0 and 1. A value of 1 means the color is fully visible (opaque), while 0 means it's completely see-through (transparent). Values between 0 and 1 make the color partially transparent. |
The value 1 is the default one. Scalar in range [0,1]. |
| 5 | LineStyle The LineStyle property for a rectangle determines the style of the line used to draw the rectangle's edges. |
It takes values : "-" (default) | "--" | ":" | "-." | "none" |
| 6 | LineWidth Specifies the line width |
It takes a positive value.The default is 0.5. |
Interactivity Properties
| Sr.No | Property & Description | Values Used |
|---|---|---|
| 1 | Visible Visibility state, specified as "on" or "off", or as numeric or logical 1 (true) or 0 (false). "on" is the same as true, and "off" is the same as false. |
Values are on/off.Default is on. |
| 2 | Selected Selection state, specified as 'on' or 'off', or as numeric or logical 1 (true) or 0 (false). |
Values are on/off.Default is off. |
Examples for rectangle() function
Here will take a look at drawing reactable using rectangle() function.
Example 1: Draw rectangle using rectangle('Position',pos)
The code we have is −
pos = [2, 3, 4, 5];

rectangle('Position', pos);
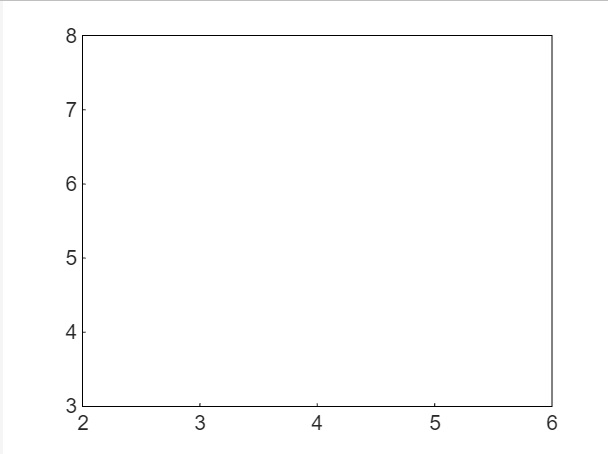
This code will create a figure with a rectangle drawn at position (2, 3) with a width of 4 units and a height of 5 units
The output on execution is −
Example 2: Draw rectangle using rectangle('Position',pos,'Curvature',cur)
The code for above is −
pos = [2, 3, 4, 5];
cur = [0.2, 0.6];
rectangle('Position', pos, 'Curvature', cur);
This code will create a figure with a rectangle drawn at position (2, 3) with a width of 4 units and a height of 5 units. The sides of the rectangle will be curved with a curvature of 0.2 for the horizontal sides and 0.6 for the vertical sides.
The output we have is −

Example 3: Draw rectangle using rectangle(___,Name,Value)
The code we have is −
pos = [2, 3, 4, 5];
rectangle('Position', pos, 'FaceColor', 'red', 'EdgeColor', 'blue', 'LineWidth', 2);
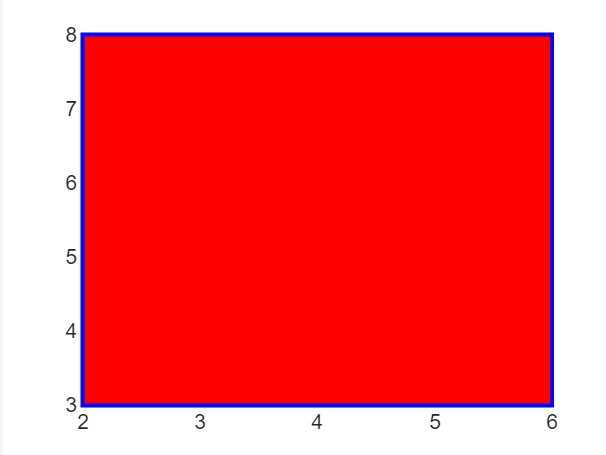
This code will create a figure with a rectangle drawn at position (2, 3) with a width of 4 units and a height of 5 units. The rectangle's face color will be red, its edge color will be blue, and its line width will be 2 units.
Output
Example 4: Draw rectangle using rectangle(ax,___)
The code we have is −
ax1 = subplot(1,2,1);
pos = [0.2, 0.3, 0.4, 0.5];
rectangle(ax1, 'Position', pos, 'FaceColor', 'blue', 'EdgeColor', 'red');
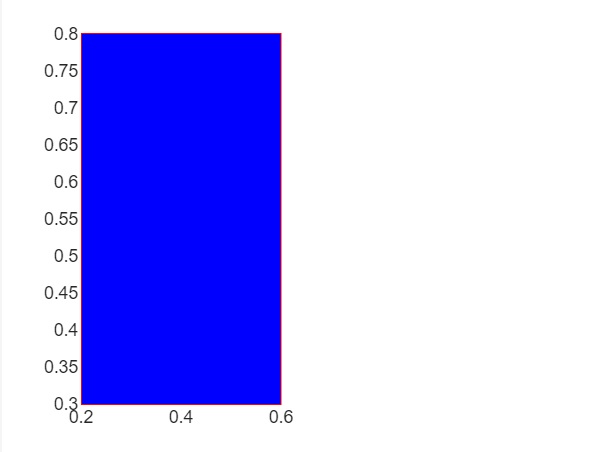
The rectangle function is used to draw a rectangle in the first set of axes (ax1). The rectangle is positioned at (0.2, 0.3) with a width of 0.4 and a height of 0.5. The rectangle's face color is blue, and its edge color is red. This example demonstrates how to draw a rectangle in a specific set of axes (ax1).
Output
Example 5: Draw rectangle using r = rectangle(___)
The code we have is −
r = rectangle('Position', [0.1, 0.1, 0.5, 0.5], 'FaceColor', 'green', 'EdgeColor', 'blue');
In this example, a rectangle is created with a specific position and appearance, and the resulting rectangle object is stored in the variable r. This allows you to modify the rectangle's properties, such as its position, size, color, etc., after it has been created.
Output
