- Seaborn - Home
- Seaborn - Introduction
- Seaborn - Environment Setup
- Importing Datasets and Libraries
- Seaborn - Figure Aesthetic
- Seaborn- Color Palette
- Seaborn - Histogram
- Seaborn - Kernel Density Estimates
- Visualizing Pairwise Relationship
- Seaborn - Plotting Categorical Data
- Distribution of Observations
- Seaborn - Statistical Estimation
- Seaborn - Plotting Wide Form Data
- Multi Panel Categorical Plots
- Seaborn - Linear Relationships
- Seaborn - Facet Grid
- Seaborn - Pair Grid
- Seaborn Useful Resources
- Seaborn - Quick Guide
- Seaborn - cheatsheet
- Seaborn - Useful Resources
- Seaborn - Discussion
Seaborn.stripplot() method
The seaborn.stripplot() method is used to draw a scatter plot where one of variables passed as argument is a categorical variable. This plot can be drawn on its own but usually it is also used to complement other plots such as box plot where, along with depicting all the observations some underlying distributions are also needed to be shown.
This method takes input in different formats such as array, long-from data, wide-form data or list of vectors.
Syntax
Following is the syntax of the seaborn.stripplot() method
seaborn.stripplot(*, x=None, y=None, hue=None, data=None, order=None, hue_order=None, jitter=True, dodge=False, orient=None, color=None, palette=None, size=5, edgecolor='gray', linewidth=0, ax=None, **kwargs
Parameters
Some of the parameters of this method are as follows −
| S.No | Name and Description |
|---|---|
| 1 | x,y These parameters take names of variables as input that plot the long form data. |
| 2 | data This is the dataframe that is used to plot graphs. |
| 3 | hue Names of variables in the dataframe that are needed for plotting the graph. |
| 4 | jitter This parameter takes a floating value and based on this value it spaces out the categorical variables data. It only works on categorical data. |
| 5 | linewidth This parameter takes floating values and determines the width of the gray lines that frame the elements in the plot. |
| 6 | dodge This parameter takes a Boolean value. if we use hue nesting, passing true to this parameter will separate the strips for different hue levels. If False is passed, the points for each level will be plotted on top of each other. |
| 7 | orient It takes values h or v and the orientation of the graph is determined based on this. |
| 8 | color matplotlib color is taken as input and this determines the color of all the elements. |
let us load the seaborn library and the dataset before moving on to the developing the plots.
Loading the seaborn library
To load or import the seaborn library the following line of code can be used.
Import seaborn as sns
Loading the dataset
in this article, we will make use of the Titanic dataset inbuilt in the seaborn library. the following command is used to load the dataset.
titanic=sns.load_dataset("titanic")
The below mentioned command is used to view the first 5 rows in the dataset. This enables us to understand what variables can be used to plot a graph.
titanic.head()
The below is the output for the above piece of code.
index,survived,pclass,sex,age,sibsp,parch,fare,embarked,class,who,adult_male,deck,embark_town,alive,alone
0,0,3,male,22.0,1,0,7.25,S,Third,man,true,NaN,Southampton,no,false
1,1,1,female,38.0,1,0,71.2833,C,First,woman,false,C,Cherbourg,yes,false
2,1,3,female,26.0,0,0,7.925,S,Third,woman,false,NaN,Southampton,yes,true
Now that we have loaded the dataset, we will explore a few examples.
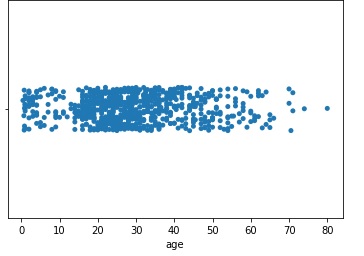
Example 1
we will understand a simple shortcut that can be used to plot a stripplot(). instead of passing the data and x as separate parameters , they can be combined and be passed as a single argument in the x parameter. The following line of code can be used to do so.
import seaborn as sns
import matplotlib.pyplot as plt
titanic=sns.load_dataset("titanic")
titanic.head()
sns.stripplot(x=titanic["age"])
plt.show()
Output
The output produced by the above line of code is as follows,
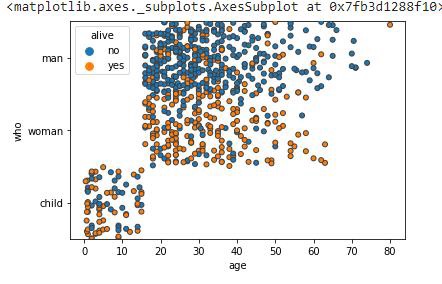
Example 2
now, we will pass the hue parameter along with the x,y parameters and see the change in the plot obtained. Since, we are using the titanic dataset, we will pass the alive variable to hue and also pass age and sex to x an dy parameters respectively. The required plot can be produced by using the below mentioned line of code.
import seaborn as sns
import matplotlib.pyplot as plt
titanic=sns.load_dataset("titanic")
titanic.head()
sns.stripplot(x="age", y="who", hue="alive",data=titanic)
plt.show()
Output
The plot produced can be seen below.

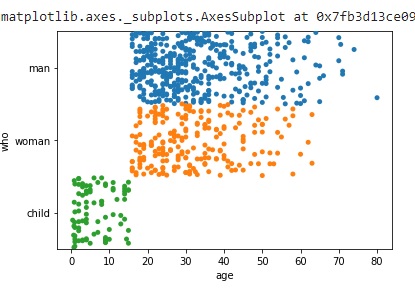
Example 3
There are many parameters in the seaborn.stripplot() method and we will see the working of another parameter called jitter. jitter parameter is used to space out the categorical variables data and it works only on data of categorical kind. it takes floating values as input.
The below code snippet depicts its usage and the plot thus produced can also be viewed below.
import seaborn as sns
import matplotlib.pyplot as plt
titanic=sns.load_dataset("titanic")
titanic.head()
#jitter spaces out categorical data and works only on this type of data.
sns.stripplot(x="age", y="who", data=titanic,jitter=0.5)
plt.show()
Output
Example 4
there are many parameters in the seaborn.stripplot() method and we will see the working of another parameter called jitter and linewidth. jitter parameter is used to space out the categorical variables data and it works only on data of categorical kind. it takes floating values as input. linewidth parameter takes floating values and determines the width of the gray lines that frame the elements in the plot.
the below code snipper depicts its usage and the plot thus produced can also be viewed below.
import seaborn as sns
import matplotlib.pyplot as plt
titanic=sns.load_dataset("titanic")
titanic.head()
sns.stripplot(x="age", y="who", hue="alive",data=titanic,jitter=0.5,linewidth=1)
plt.show()
Output
the output plot can be seen below.
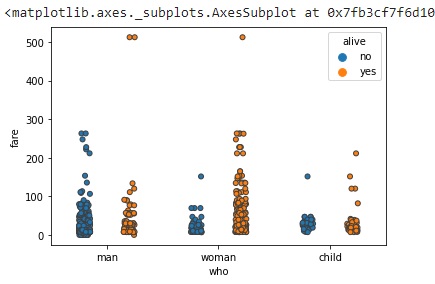
Example 5
in this example we will understand how to use the dodge parameter along with the parameters used above. This parameter takes a boolean value. if we use hue nesting, passing true to this parameter will separate the strips for different hue levels. If False is passed, the points for each level will be plotted on top of each other. the below line of code can be used to plot a graph using the dodge parameter.
import seaborn as sns
import matplotlib.pyplot as plt
titanic=sns.load_dataset("titanic")
titanic.head()
sns.stripplot(y="fare", x="who", hue="alive",data=titanic,linewidth=1,dodge=True)
plt.show()
Output
the output thus obtained is as follows,