- Seaborn - Home
- Seaborn - Introduction
- Seaborn - Environment Setup
- Importing Datasets and Libraries
- Seaborn - Figure Aesthetic
- Seaborn- Color Palette
- Seaborn - Histogram
- Seaborn - Kernel Density Estimates
- Visualizing Pairwise Relationship
- Seaborn - Plotting Categorical Data
- Distribution of Observations
- Seaborn - Statistical Estimation
- Seaborn - Plotting Wide Form Data
- Multi Panel Categorical Plots
- Seaborn - Linear Relationships
- Seaborn - Facet Grid
- Seaborn - Pair Grid
- Seaborn Useful Resources
- Seaborn - Quick Guide
- Seaborn - cheatsheet
- Seaborn - Useful Resources
- Seaborn - Discussion
Seaborn.set_theme method
The Seaborn.set_theme() method is used to set the parameters that control the general style of the plots. In other words, this method sets all the aspects of matplotlib and seaborn plots visually.
The theming performed by this function is divided into various sets of parameter values while changing all the defaults of all the plots using matplotlib rcParams system.
Syntax
Following is the syntax of the set_theme() method −
seaborn.set_theme(context='notebook', style='darkgrid', palette='deep', font='sans-serif', font_scale=1, color_codes=True, rc=None)
Parameters
The parameters of this method are discussed below.
| S.No | Method and Description |
|---|---|
| 1 | Context Takes a string or dict as input and scales parameters. |
| 2 | Style Takes a string or dict as input and determines the axes style parameters |
| 3 | Palette Takes a string or sequence as input and determines the color palette |
| 4 | Font Takes a string as input and sets the font family for the plots. |
| 5 | Font_scale Takes a floating value as input and separates the scaling factor to independently scale the size of the font elements. |
| 6 | Color_codes Takes a Boolean value and if true and palette is a seaborn palette, remaps the shorthand color codes to the colors form his palette. |
| 7 | rc Takes a dict as input and takes values to override the above values. |
Loading the seaborn library
Let us load the seaborn library and the dataset before moving on to the developing the plots. To load or import the seaborn library the following line of code can be used.
Import seaborn as sns
Loading the dataset
In this article, we will make use of the Tips dataset inbuilt in the seaborn library. the following command is used to load the dataset.
tips=sns.load_dataset("tips")
The below mentioned command is used to view the first 5 rows in the dataset. This enables us to understand what variables can be used to plot a graph.
tips.head()
the below is the output for the above piece of code.
index,total_bill,tip,sex,smoker,day,time,size
0,16.99,1.01,Female,No,Sun,Dinner,2
1,10.34,1.66,Male,No,Sun,Dinner,3
2,21.01,3.5,Male,No,Sun,Dinner,3
3,23.68,3.31,Male,No,Sun,Dinner,2
4,24.59,3.61,Female,No,Sun,Dinner,4
Now that we have loaded the data, we will move onto understanding how the method works in the following examples.
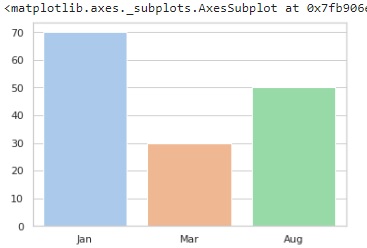
Example 1
We are setting the theme in the below code and then plotting a barplot to see if the changes have been refelected. In the below code, the style of the theme is set to whitegrid and the palette is pastel which means that the plot obtained will have pastel colors in it. Later a barplot is initialized to view the plot and the x and y parameters of the bar plot are lists that contain some values to plot.
import seaborn as sns
import matplotlib.pyplot as plt
tips=sns.load_dataset("tips")
tips.head()
sns.set_theme(style="whitegrid", palette="pastel")
sns.barplot(x=["Jan", "Mar", "Aug"], y=[70, 30, 50])
plt.show()
Output
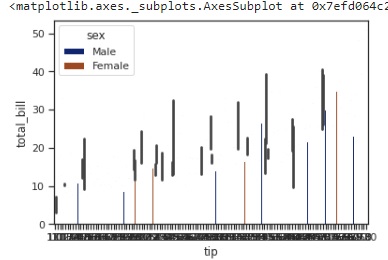
Example 2
We will use the tips dataset to plot in this example, instead of inititalizing like in the previous example. We are passing the tips dataset and the columns, tip, total_bill and sex to the barplot method to be plotted and the style is set to ticks and the palette is chosen as dark in this case
import seaborn as sns
import matplotlib.pyplot as plt
tips=sns.load_dataset("tips")
tips.head()
sns.set_theme(style="ticks", palette="dark")
sns.barplot(data=tips,x="tip" ,y="total_bill",hue="sex")
plt.show()
Output
The output plot obtained is as follows −
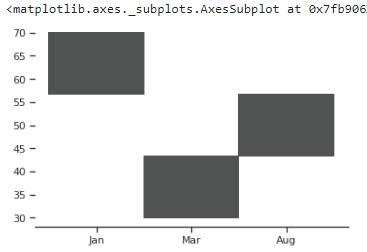
Example 3
In this example, custom parameters are set and these are passed to the set_theme() method and then a graph is plotted to see the changes made to the theme.
The custom parameters are initialized in a dictionary with key value pairs and can be seen below.
import seaborn as sns
import matplotlib.pyplot as plt
tips=sns.load_dataset("tips")
tips.head()
custom_params = {"axes.spines.right": False, "axes.spines.top": False,"axes.spines.left":False}
sns.set_theme(style="ticks", palette="light:#5A9",rc=custom_params,color_codes=True)
sns.histplot(x=["Jan", "Mar", "Aug"], y=[70, 30, 50])
plt.show()
Output
The plot obtained is as follows −