- Seaborn - Home
- Seaborn - Introduction
- Seaborn - Environment Setup
- Importing Datasets and Libraries
- Seaborn - Figure Aesthetic
- Seaborn- Color Palette
- Seaborn - Histogram
- Seaborn - Kernel Density Estimates
- Visualizing Pairwise Relationship
- Seaborn - Plotting Categorical Data
- Distribution of Observations
- Seaborn - Statistical Estimation
- Seaborn - Plotting Wide Form Data
- Multi Panel Categorical Plots
- Seaborn - Linear Relationships
- Seaborn - Facet Grid
- Seaborn - Pair Grid
- Seaborn Useful Resources
- Seaborn - Quick Guide
- Seaborn - cheatsheet
- Seaborn - Useful Resources
- Seaborn - Discussion
Seaborn.set_color_codes() method
The Seaborn.set_color_codes() method is used to change how matplotlib color shorthands are interpreted. Calling this will alter how matplotlib interprets shorthand codes like "b" or "g" in next plots.
A matplotlib color shorthand is nothing but the shortcuts we use to represent a color. For instance, single character shorthands are used to represent basic colors like blue (b), green(g), red(r), yellow(y) etc.
Syntax
Following is the syntax of the seaborn.set_color_codes() method −
seaborn.set_color_codes(palette='deep')
Parameters
This parameter has one parameter, and it is explained below.
| S.No | Parameter and Description |
|---|---|
| 1 | palette Takes the values {deep, muted, pastel, dark, bright, colorblind} and is used to Name seaborn palette to use as the source of colors. |
Before, we move into the examples, we will see how to load dataset from the seaborn library.
Loading the seaborn library
To load or import the seaborn library the following line of code can be used.
Import seaborn as sns
Loading the dataset
in this article, we will make use of the Tips dataset inbuilt in the seaborn library. the following command is used to load the dataset.
tips=sns.load_dataset("tips")
The below mentioned command is used to view the first 5 rows in the dataset. This enables us to understand what variables can be used to plot a graph.
tips.head()
the below is the output for the above piece of code.
index,total_bill,tip,sex,smoker,day,time,size
0,16.99,1.01,Female,No,Sun,Dinner,2
1,10.34,1.66,Male,No,Sun,Dinner,3
2,21.01,3.5,Male,No,Sun,Dinner,3
3,23.68,3.31,Male,No,Sun,Dinner,2
4,24.59,3.61,Female,No,Sun,Dinner,4
Now that we have loaded the data, we will move onto understanding how the method works in the following examples.
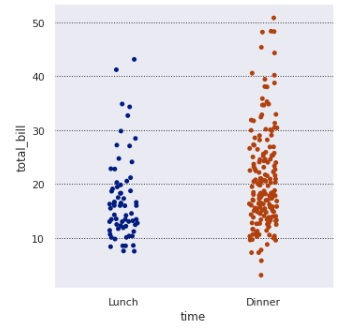
Example 1
In this example, we will see how to use the set_color_codes() method of seaborn and pass a parameter to it. Later we will plot a graph to make use of the color codes that are set. We are using the tips dataset in this example and a categorical plot is plotted after the color codes are set.
import seaborn as sns
import matplotlib.pyplot as plt
tips=sns.load_dataset("tips")
tips.head()
sns.set_color_codes("dark")
sns.catplot(data=tips,x="time",y="total_bill")
plt.show()
Output
The output produced is seen below,
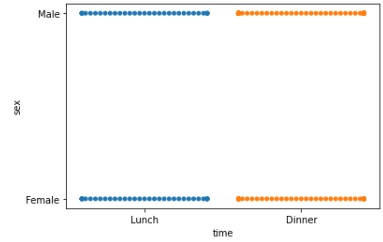
Example 2
We will pass another value to the set_color_codes() method and see how the graph changes. Here, dark is passed as an argument and later a plot is drawn to see how the graph color code has changed.
import seaborn as sns
import matplotlib.pyplot as plt
tips=sns.load_dataset("tips")
tips.head()
sns.set_color_codes("dark")
sns.swarmplot(data=tips,x="time",y="sex")
plt.show()
Output
The output obtained is as follows −
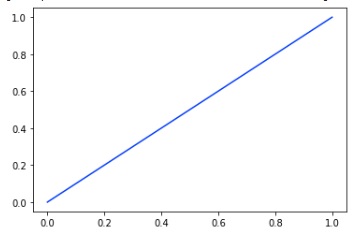
Example 3
We are plotting a graph using mathplotlib pyplot method instead of using a seaborn method and passing a dataset. In this way, we can understand that seaborn methods work for all kinds of plots and not just for seaborn plots. The color code is set to bright in this example and the plot obtained is attached below.
import seaborn as sns
import matplotlib.pyplot as plt
tips=sns.load_dataset("tips")
tips.head()
sns.set_color_codes("bright")
plt.plot([0, 1], color="b")
plt.show()
Output
the output is as follows,
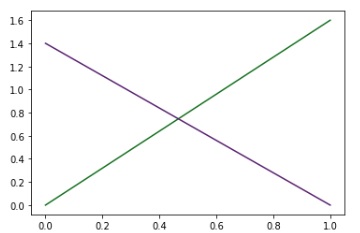
Example 4
In this case, we will set the color code to dark and then plot a graph using the matplotlib pyplot method and set the colors to green and purple. The variable to be passed to the color parameter for this is g for green and m for purple.
import seaborn as sns
import matplotlib.pyplot as plt
tips=sns.load_dataset("tips")
tips.head()
sns.set_color_codes("dark")
_ = plt.plot([0, 1.6], color="g")
_ = plt.plot([1.4, 0], color="m")
plt.show()
Output
The plot obtained is below,