- Seaborn - Home
- Seaborn - Introduction
- Seaborn - Environment Setup
- Importing Datasets and Libraries
- Seaborn - Figure Aesthetic
- Seaborn- Color Palette
- Seaborn - Histogram
- Seaborn - Kernel Density Estimates
- Visualizing Pairwise Relationship
- Seaborn - Plotting Categorical Data
- Distribution of Observations
- Seaborn - Statistical Estimation
- Seaborn - Plotting Wide Form Data
- Multi Panel Categorical Plots
- Seaborn - Linear Relationships
- Seaborn - Facet Grid
- Seaborn - Pair Grid
- Seaborn Useful Resources
- Seaborn - Quick Guide
- Seaborn - cheatsheet
- Seaborn - Useful Resources
- Seaborn - Discussion
Seaborn.boxenplot() method
Seaborn.boxenplot() method is used to draw an enhanced box plot. It is generally done so for larger datasets. Because it displays a sizable number of quantiles that are classified as "letter values," this type of graphic was initially called a "letter value" plot. Plotting a nonparametric representation of a distribution with all characteristics according to actual observations is comparable to a box plot. Plotting more quantiles reveals more details about the distribution's shape, especially in the tails.
Syntax
Following is the syntax of the seaborn.boxenplot() method −
seaborn.boxenplot(*, x=None, y=None, hue=None, data=None, order=None, hue_order=None, orient=None, color=None, palette=None, saturation=0.75, width=0.8, dodge=True, k_depth='tukey', linewidth=None, scale='exponential', outlier_prop=0.007, trust_alpha=0.05, showfliers=True, ax=None, **kwargs)
Parameters
Some of the parameters of the boxenplot() method are discussed below −
| S.No | Name and Description |
|---|---|
| 1 | x,y These parameters take names of variables as input that plot the long form data. |
| 2 | data This is the dataframe that is used to plot graphs. |
| 3 | hue Names of variables in the dataframe that are needed for plotting the graph. |
| 4 | linewidth This parameter takes floating values and determines the width of the gray lines that frame the elements in the plot. |
| 5 | dodge This parameter takes a boolean value. if we use hue nesting, passing true to this parameter will separate the strips for different hue levels. If False is passed, the points for each level will be plotted on top of each other. |
| 6 | orient It takes values h or v and the orientation of the graph is determined based on this. |
| 7 | color matplotlib color is taken as input and this determines the color of all the elements. |
| 8 | palette This parameter specifies the colors for different hue mappings. |
| 9 | showfliers Takes a boolean value and suppresses the plotting of outliers if False is passed. |
| 10 | saturation Takes a floating value and the proportion of the original saturation to draw colors is determined by this value. |
Loading the seaborn library
Let us load the Seaborn library and the dataset before moving on to developing the plots. To load or import the seaborn library the following line of code can be used.
Import seaborn as sns
Loading the dataset
In this article, we will make use of the Titanic dataset inbuilt in the Seaborn library. the following command is used to load the dataset.
titanic=sns.load_dataset("titanic")
The below mentioned command is used to view the first 5 rows in the dataset. This enables us to understand what variables can be used to plot a graph.
titanic.head()
The below is the output for the above piece of code.
index,survived,pclass,sex,age,sibsp,parch,fare,embarked,class,who,adult_male,deck,embark_town,alive,alone
0,0,3,male,22.0,1,0,7.25,S,Third,man,true,NaN,Southampton,no,false
1,1,1,female,38.0,1,0,71.2833,C,First,woman,false,C,Cherbourg,yes,false
2,1,3,female,26.0,0,0,7.925,S,Third,woman,false,NaN,Southampton,yes,true
Now that we have loaded the dataset, we will explore a few examples.
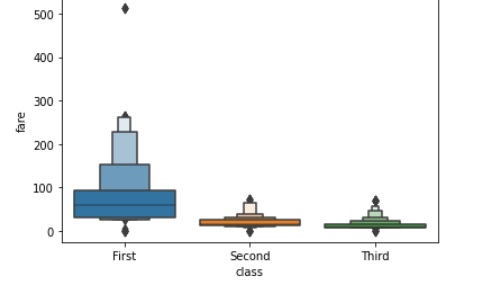
Example 1
In this example, we will plot a simple boxen plot using the x and y parameters. The in-built titanic dataset is being used for understanding the usage of the boxenplot() method in this article. We will pass the class and fare columns to the method. The below line of code can be used to do so.
import seaborn as sns
import matplotlib.pyplot as plt
titanic=sns.load_dataset("titanic")
titanic.head()
sns.boxenplot(x="class", y="fare", data=titanic)
plt.show()
Output
The output obtained after running the above line of code is as follows −
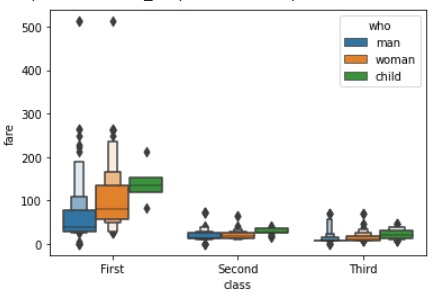
Example 2
We will understand the usage of the hue parameter. This parameter takes a categorical variable as input and plots the graph accordingly. Since we are using the titanic dataset, we are passing the who variable that has values man woman and child. The below line of code can be used to do so.
import seaborn as sns
import matplotlib.pyplot as plt
titanic=sns.load_dataset("titanic")
titanic.head()
sns.boxenplot(x="class", y="fare",hue="who", data=titanic)
plt.show()
Output
the output for the above line of code is seen below.
Example 3
The function seaborn.boxenplot() method has various parameters and linewidth is one such parameter. This parameter takes floating values and determines the width of the gray lines that frame the elements in the plot. In the below example, linewidth is passed a value 5 and the change in plot can be seen below. To pass values to the linewidth method, the following line of code can be used.
import seaborn as sns
import matplotlib.pyplot as plt
titanic=sns.load_dataset("titanic")
titanic.head()
sns.boxenplot(x="class", y="fare",hue="who", linewidth=5,data=titanic)
plt.show()
Output
the output is as follows −
sns.boxenplot(x="class", y="fare",hue="who", linewidth=5,data=titanic)
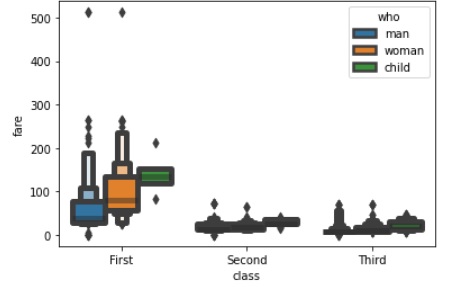
The lines obtained are so thick that the plot is covered. This was done on purpose to show the working of this parameter.
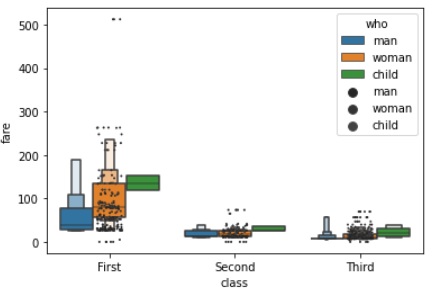
Example 4
The function seaborn.boxenplot() method has various parameters and we will understand the working of some other parameters such as show fliers, size and color in this example.
Show fliers parameter takes a Boolean value and suppresses the plotting of outliers if False is passed. The color parameter takes matplotlib color as input and this determines the color of all the elements. The size parameter takes a floating point value as input and the size of the markers is determined by this input.
import seaborn as sns
import matplotlib.pyplot as plt
titanic=sns.load_dataset("titanic")
titanic.head()
sns.boxenplot(x="class", y="fare",hue="who",showfliers=False,data=titanic)
sns.stripplot(x="class",y="fare",hue="who",size=2,color=".26",data=titanic)
plt.show()
Output
the output for the above line of code is as follows,