- Generative AI - Home
- Generative AI Basics
- Generative AI Basics
- Generative AI Evolution
- ML and Generative AI
- Generative AI Models
- Discriminative vs Generative Models
- Types of Gen AI Models
- Probability Distribution
- Probability Density Functions
- Maximum Likelihood Estimation
- Generative AI Networks
- How GANs Work?
- GAN - Architecture
- Conditional GANs
- StyleGAN and CycleGAN
- Training a GAN
- GAN Applications
- Generative AI Transformer
- Transformers in Gen AI
- Architecture of Transformers in Gen AI
- Input Embeddings in Transformers
- Multi-Head Attention
- Positional Encoding
- Feed Forward Neural Network
- Residual Connections in Transformers
- Generative AI Autoencoders
- Autoencoders in Gen AI
- Autoencoders Types and Applications
- Implement Autoencoders Using Python
- Variational Autoencoders
- Generative AI and ChatGPT
- A Generative AI Model
- Generative AI Miscellaneous
- Gen AI for Manufacturing
- Gen AI for Developers
- Gen AI for Cybersecurity
- Gen AI for Software Testing
- Gen AI for Marketing
- Gen AI for Educators
- Gen AI for Healthcare
- Gen AI for Students
- Gen AI for Industry
- Gen AI for Movies
- Gen AI for Music
- Gen AI for Cooking
- Gen AI for Media
- Gen AI for Communications
- Gen AI for Photography
The Role of Probability Density Functions in Generative AI Models
Probability Distributions can be either discrete or continuous.
- Discrete probability distributions are better suited for scenarios where the outcome can only take a discrete or categorial random variables.
- Continuous probability distributions are more appropriate when the outcome takes on any value within a continuous range of values.
In the context of generative modeling, continuous probability distributions serve as a powerful tool that aims to create realistic and diverse data samples across a wide range of applications. In fact, they help generative models understand and mimic real-world data better.
One of the key concepts behind continuous probability distribution is the Probability Density Function (PDF) that describes the likelihood of a continuous random variable, such as time, weight, or height, taking on a specific value within a given range. In this chapter, well demystifying Probability Density Function in detail.
Understanding the Probability Density Function (PDF)
In the case of discrete variables, we can easily calculate the probability. But, on the other hand, for continuous variables it is quite difficult to calculate the probability as the probability takes on a range of infinite values. In statistics, the function that describes the probability of such variables is known as probability density function (PDF).
In simple terms, the probability density function is a function defining the relationship between a continuous random variable (say X) and its probability. We can find the probability of the variable X by using the function.
Mathematically, a PDF f(x) for a continuous random variable X must satisfy the below given properties −
- $\mathrm{f(x) \geq 0}$ for all x in the range of X.
- The total area under the curve of the PDF over all possible values of X is equal to 1. This represents the total probability space.
- The probability of X falling within a specific interval [a,b] is given by the integral of f(x) over that interval: $\mathrm{\int_{a}^{b} \: f(x) \: dx}$.
After plotting the PDF, we will get the graph as below −
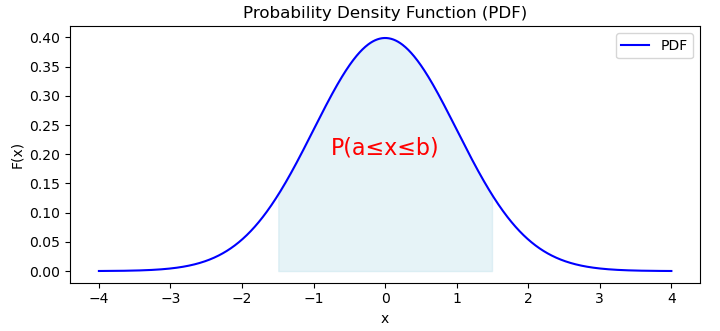
Probability Distribution Function, a fundamental concept in probability theory, provides us with a continuous representation of the probability distribution that allows us to understand how likely different outcomes occur with a continuous domain. It is widely used in various fields such as machine learning, statistics, and physics.
Implementing Probability Density Function using Python
In Python, to find the probability density function (PDF) of a given dataset, we can use libraries like NumPy and Matplotlib. Below is a simple example of calculating and plotting the PDF of a dataset −
Example
# importing necessary libraries
import numpy as np
import matplotlib.pyplot as plt
from scipy.stats import norm

# Creating Sample dataset
data = np.random.normal(loc=0, scale=1, size=1000)

# Fit a Gaussian distribution to the data
mu, std = norm.fit(data)

# Plot the histogram of the data
plt.figure(figsize=(7.2, 2.5))
plt.hist(data, bins=50, density=True, alpha=0.5, color='cyan')

# Plot the PDF of the fitted Gaussian distribution
xmin, xmax = plt.xlim()
x = np.linspace(xmin, xmax, 100)
p = norm.pdf(x, mu, std)
plt.plot(x, p, 'g', linewidth=2)

plt.xlabel('Value')
plt.ylabel('Probability Density')
plt.title('Probability Density Function (PDF)')
plt.grid(True)

plt.show()
In this above code, we first generate a random dataset using NumPy's np.random.normal() function.
Then, we fit a Gaussian distribution to the data using norm.fit() from SciPy. This function returns the mean (mu) and standard deviation (std) of the fitted Gaussian distribution.
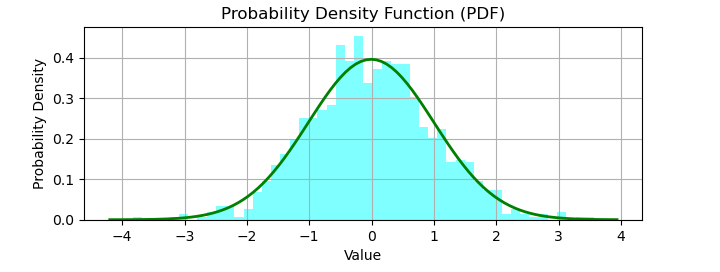
After that, we plot the histogram of the data using Matplotlib's plt.hist(). Finally, we plot the smooth bell curve (PDF) on top of the histogram.
Output
On running this code, you will get an output graph like this −
Role of Probability Density Function in Generative Modeling
In generative modeling, probability density functions (PDFs) play several key roles as given below −
Modeling Data Distribution
Modeling data distribution is one of the important tasks in generative modeling. As we know, the probability density function provides a mathematical representation of the underlying data distribution. PDF helps generative models to describe the observed data best.
Sampling Data
Once the generative model learns the PDF, it can be used to sample new data points from the modeled data distribution. This sampling process helps generative models to generate new data samples that closely resemble the original data.
Likelihood Estimation
Many generative modeling algorithms such as maximum likelihood estimation (MLE) and variational inference use likelihood estimation. PDFs help generative models by estimating the likelihood of observing a particular data point given the parameters of the distribution.
Generative Adversarial Networks (GANs)
In GANs, we have one network called the generator. The generator learns to generate realistic data samples by capturing the underlying data distribution. It typically outputs data points that follow a continuous distribution, and the probability density function associated with this distribution guides the learning process.
Variational Autoencoders (VAEs)
VAEs learn a low-dimensional latent space that captures the salient features of the data. Probability density functions are used to model the distribution of latent variables. It allows the model to generate new data samples by sampling from this latent space and decoding the samples into the original data space.
Evaluation of Model Performance
Probability density functions can also be used to evaluate the performance of generative models. Some of the metrics such as log-likelihood or divergence measures quantify how well the learned distribution matches the true data distribution. It provides us with insights into the quality of the generated samples.
Conclusion
In this chapter, we explained in detail the probability density function (PDF), its implementation in Python, and its multifaceted role in generative modeling.
PDF is a fundamental concept in probability theory that provides us with a continuous representation of the probability distribution to help us to understand how likely different outcomes occur with a continuous domain. We understood how PDF defines the relationship between a continuous random variable and its probability.
We also demonstrated, through an example, how to implement probability density function using Python. Probability density functions serve as an essential tool in generative modeling, enabling the representation, sampling, and evaluation of data distributions, and serving as the foundation for various generative modeling algorithms.