- WebdriverIO - Home
- WebdriverIO - Introduction
- WebdriverIO - Prerequisite
- WebdriverIO - Architecture
- WebdriverIO - Getting Started with NodeJS
- WebdriverIO - Installation of NPM
- WebdriverIO - VS Code Installation
- WebdriverIO - Package.json
- WebdriverIO - Mocha Installation
- Selenium Standalone Server Installation
- WebdriverIO - Configuration File generation
- WebdriverIO - VS Code Intellisense
- WebdriverIO - Wdio.conf.js file
- WebdriverIO - Xpath Locator
- WebdriverIO - CSS Locator
- WebdriverIO - Link Text Locator
- WebdriverIO - ID Locator
- WebdriverIO - Tag Name Locator
- WebdriverIO - Class Name Locator
- WebdriverIO - Name Locator
- Expect Statement for Assertions
- WebdriverIO - Happy Path Flow
- WebdriverIO - General Browser Commands
- WebdriverIO - Handling Browser Size
- WebdriverIO - Browser Navigation Commands
- Handling Checkboxes & Dropdowns
- WebdriverIO - Mouse Operations
- Handling Child Windows/Pop ups
- WebdriverIO - Hidden Elements
- WebdriverIO - Frames
- WebdriverIO - Drag & Drop
- WebdriverIO - Double Click
- WebdriverIO - Cookies
- WebdriverIO - Handling Radio Buttons
- Chai Assertions on webelements
- WebdriverIO - Multiple Windows/Tabs
- WebdriverIO - Scrolling Operations
- WebdriverIO - Alerts
- WebdriverIO - Debugging Code
- WebdriverIO - Capturing Screenshots
- WebdriverIO - JavaScript Executor
- WebdriverIO - Waits
- WebdriverIO - Running Tests in Parallel
- WebdriverIO - Data Driven Testing
- Running Tests from command-line parameters
- Execute Tests with Mocha Options
- Generate HTML reports from Allure
- WebdriverIO Useful Resources
- WebdriverIO - Quick Guide
- WebdriverIO - Useful Resources
- WebdriverIO - Discussion
WebdriverIO - Debugging Code
To debug the WebdriverIO code in the Visual Studio Code editor, we have to enable the nightly version of JavaScript Debugger. Debugging is one of the most important steps for identifying the root cause of an error in code.
It also helps to understand the program flow.
Enable Debugging
The steps to enable debugging are listed below −
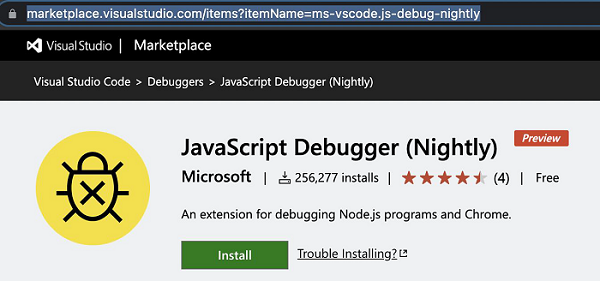
Step 1 − Navigate to the link below if you are using Windows or Linux operating system −
https://marketplace.visualstudio.com/items?itemName=ms-vscode.js-debug-nightly
Step 2 − Click on Install. The following screen will appear on your computer −
If we are using a Mac operating system, we can skip Steps 1 and 2.
Step 3 − Create a folder called the .vscode within the project. Then create a file launch.json within this folder. The following screen will appear on your computer −

Step 4 − Add the below code in the launch.json file.
{
   "configurations": [
      {
         "name": "Webdriver IO",
         "type": "node",
         "request": "launch",
         "args": ["wdio.conf.js", "--spec", "${file}"],
         "cwd": "${workspaceFolder}",
         "autoAttachChildProcesses": true,
         "program": "${workspaceRoot}/node_modules/@wdio/cli/bin/wdio.js",
         "console": "integratedTerminal",
         "skipFiles": [
            "${workspaceFolder}/node_modules/**/*.js",
            "${workspaceFolder}/lib/**/*.js",
            "<node_internals>/**/*.js"
         ]
      },
   ]
}
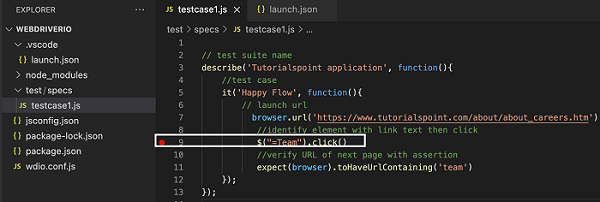
Step 5 − Add a breakpoint in the spec file. The following screen will appear on your computer −
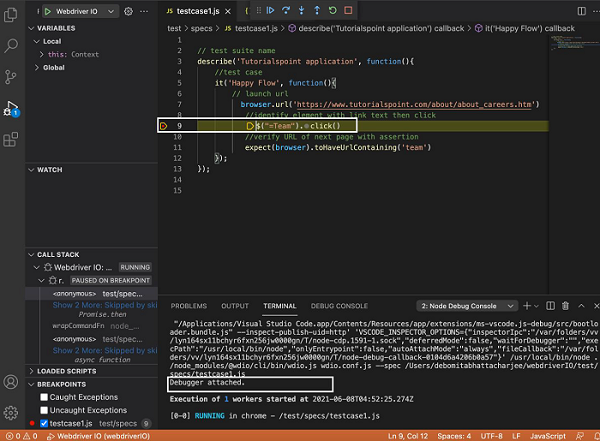
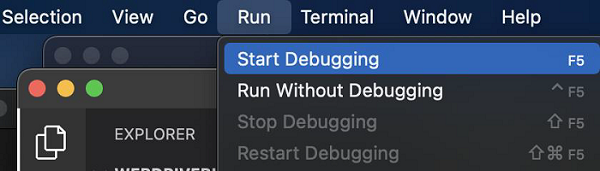
Step 6 − Go to the Run menu and select the option Start Debugging. The following screen will appear on your computer −
Step 7 − The execution shall get triggered in Debugger mode, with an orange band at the bottom. Debugger attached message should be reflected in the Terminal console. Also, the execution shall halt at the breakpoint. We have to manually resume it again.
The following screen will appear on your computer −