- WebAssembly - Home
- WebAssembly - Overview
- WebAssembly - Introduction
- WebAssembly - WASM
- WebAssembly - Installation
- WebAssembly - Tools to Compile to WASM
- WebAssembly - Program Structure
- WebAssembly - Javascript
- WebAssembly - Javascript API
- WebAssembly - Debugging WASM in Firefox
- WebAssembly - “Hello World”
- WebAssembly - Modules
- WebAssembly - Validation
- WebAssembly - Text Format
- WebAssembly - Convert WAT to WASM
- WebAssembly - Dynamic Linking
- WebAssembly - Security
- WebAssembly - Working with C
- WebAssembly - Working with C++
- WebAssembly - Working with Rust
- WebAssembly - Working with Go
- WebAssembly - Working with Nodejs
- WebAssembly - Examples
- WebAssembly Useful Resources
- WebAssembly - Quick Guide
- WebAssembly - Useful Resources
- WebAssembly - Discussion
WebAssembly - Debugging WASM in Firefox
WebAssembly support is added to all the latest browsers available with you today like Chrome, Firefox. The Firefox version 54+ onwards gives you a special feature to debug your wasm code.
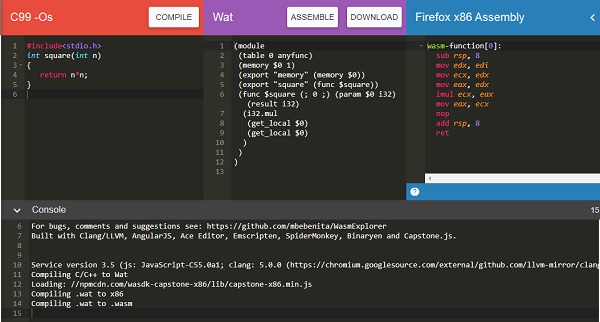
To do that, execute your code inside Firefox browsers that call wasm. For example, consider following C code that finds the square of the number.
An example for the C Program is as follows −
#include<stdio.h>
int square(int n) {
   return n*n;
}
We will make use of WASM explorer to get the wasm code −
Download WASM code and use it to see the output in the browser.
The html file that loads the wasm is as follows −
!doctype html>
<html>
   <head>
      <meta charset="utf-8">
      <title>WebAssembly Square function</title>
      <style>
         div {
            font-size : 30px; text-align : center; color:orange;
         }
      </style>
   </head>
   <body>
      <div id="textcontent"></div>
      <script>
         let square;
         fetch("findsquare.wasm").then(bytes => bytes.arrayBuffer())
            .then(mod => WebAssembly.compile(mod))
            .then(module => {return new WebAssembly.Instance(module) })
            .then(instance => {
            square = instance.exports.square(13);
            console.log("The square of 13 = " +square);
            document.getElementById("textcontent").innerHTML = "The square of 13 = " +square;
         });
      </script>
   </body>
</html>
Open your Firefox browser and load the above html file and open the debugger tool.
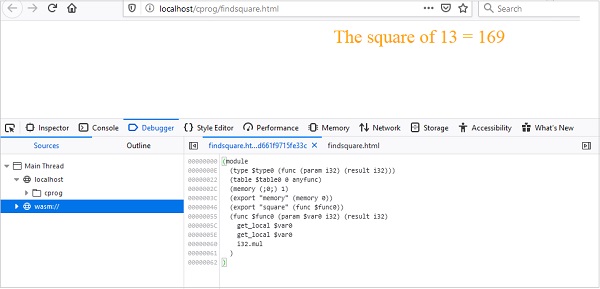
You should see wasm:// entry in the debugger tool. Click on wasm:// and it shows the wasm code converted to .wat format as shown above.
You can take a look at the code of the exported function and can debug the code, if any issue comes up. Firefox also intends to add breakpoints, so that you can debug the code and check the execution flow.