- Serverless - Home
- Serverless - Introduction
- Serverless - Installation
- Serverless - Deploying Function
- Serverless - Regions, Memory-Size, Timeouts
- Serverless - Service
- Serverless - Scheduled Lambdas
- Serverless - API Gateway Triggered Lambdas
- Serverless - Include/Exclude
- Serverless - Plugins
- Serverless - Packaging Dependencies
- Serverless - Layer Creation
- Serverless - REST API with DynamoDB
- Serverless - Telegram Echo Bot
- Serverless Useful Resources
- Serverless - Quick Guide
- Serverless - Useful Resources
- Serverless - Discussion
Serverless - Service
You wouldn't want to create a separate serverless.yml file for each function that you deploy. That would be very tedious. Luckily, serverless has provisions to deploy multiple functions within the same serverless.yml file. All these functions belong to a single group called 'service'. The service name is often the first thing defined in a serverless.yml file.
service: my-first-service

provider:
   name: aws
   runtime: python3.6
   stage: prod
   region: us-east-2
   profile: yash-sanghvi

   functions:
      func1:
      handler: handler1.func1

   func2:
      handler: handler2.func2
All the functions within a service, when deployed, take the following name format on the AWS Lambda console − service_name-stage_name-function_name. Thus, the two functions in the example above,when deployed, will take the names − my-first-service-prod-func1 and my-first-service-prod-func2. The stage parameter helps you differentiate within the different stages of code development.
Thus, if your function is in the development stage, you may use the stage dev; if it is in the testing stage, you may use the stage test; if it is in production, you may use the stage prod. This way, you can ensure that changes made to the dev stage don't affect the production codes. The stage names are not set in stone. dev, test, prod are just examples.
You can have any stage name of your choice. Please note that if you have API Gateway triggered lambdas (more on that in a later chapter), then your endpoints will be different for each stage.
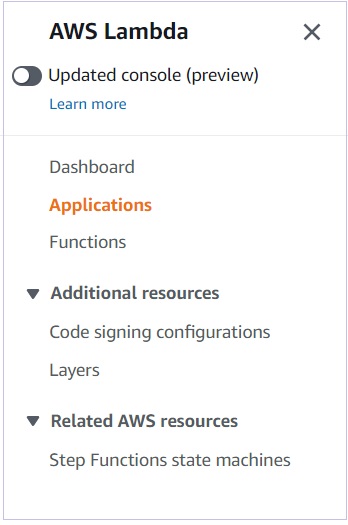
Additionally, if you go to the lesser-used 'Applications' section of the AWS Lambda Console, you will be able to see the entire service with the stage.
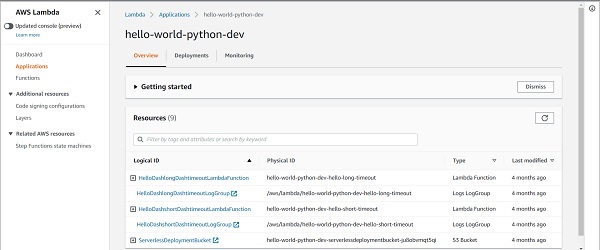
If you click on the service and stage combination of your choice, you will be able to see all the resources used by the service in one place − Lambda functions,API Gateways, Events Rules, Log groups, S3 buckets, everything.
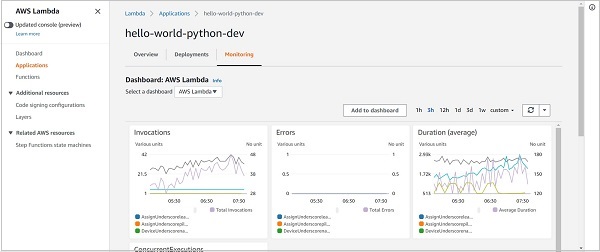
What's even more interesting is that you can go to the Monitoring tab and see the performance of your service as a whole -> Number of invocations, average duration, error count, etc. You can get an idea of which function is contributing the most to your bill. When you have several functions within your service, monitoring the performance of each individual function becomes quite difficult. The service-level Monitoring Tab helps a lot here.
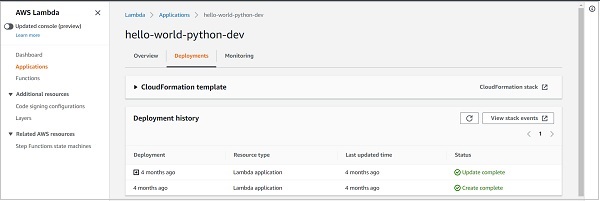
Finally, the Deployments tab helps you see all the past deployments of the service and the status of the deployments.