- MATLAB Simulink - Home
- MATLAB Simulink - Introduction
- MATLAB Simulink - Environment Setup
- MATLAB Simulink - Starting Simulink
- MATLAB Simulink - Blocks
- MATLAB Simulink - Lines
- MATLAB Simulink - Build & Simulate Model
- MATLAB Simulink - Signals Processing
- MATLAB Simulink - Adding Delay To Signals
- MATLAB Simulink - Mathematical Library
- Build Model & Apply If-else Logic
- MATLAB Simulink - Logic Gates Model
- MATLAB Simulink - Sinewave
- MATLAB Simulink - Function
- MATLAB Simulink - Create Subsystem
- MATLAB Simulink - For Loop
- MATLAB Simulink - Export Data
- MATLAB Simulink - Script
- Solving Mathematical Equation
- First Order Differential Equation
MATLAB Simulink - Export Data
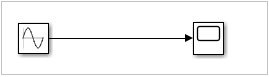
In this chapter, we will learn how to use Simulink output results inside MATLAB. Let us try a simple model of sine wave as shown below −
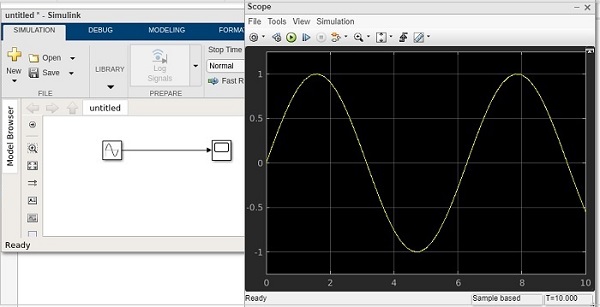
When we run the model, the scope displays the sine wave as shown below −
Now to get the data of the sine wave, go to the configuration properties and select logging tab.
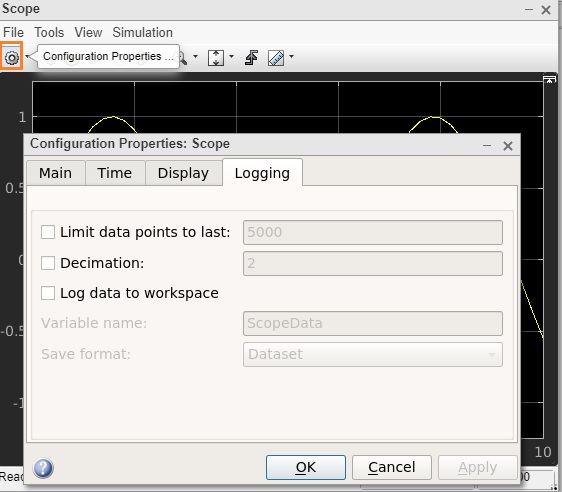
Select the log data to workspace checkbox, as shown below −
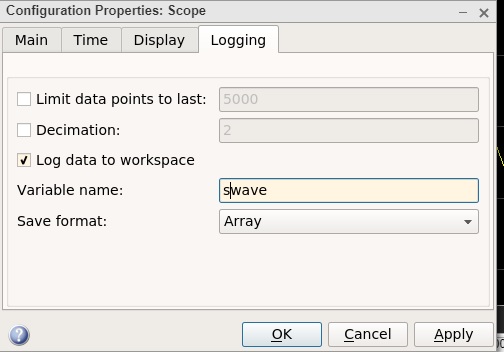
Set the variable name of your choice. Here, we have given the name as swave and the save format as Array. Click on OK button and run the simulation again.
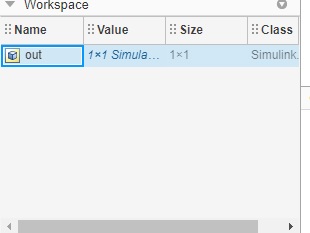
You should see the output in the workspace
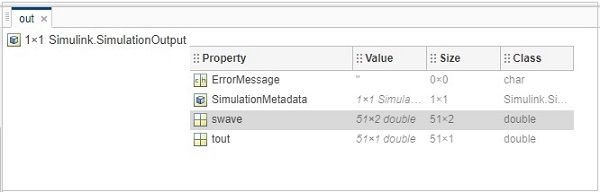
Double click and it will show you the details of the swave variable which we saved earlier.
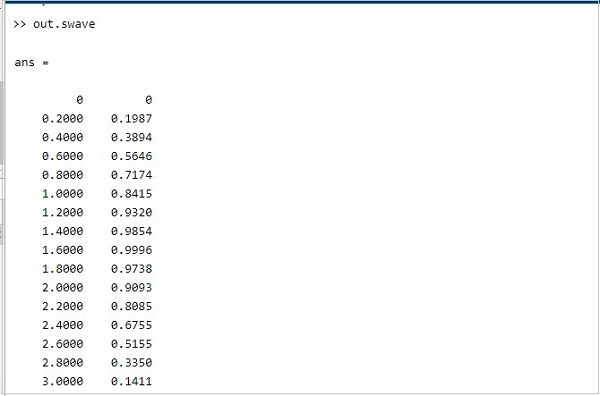
Inside command prompt type out .swave and it will give you the output as shown below −
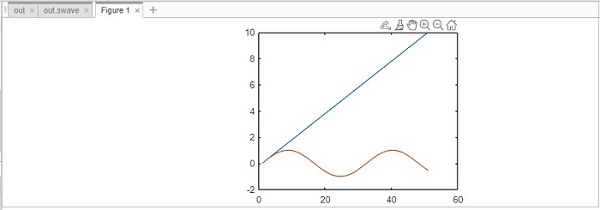
You can plot the sine wave using plot command as shown below −
The graph is shown as follows −