- ML - Home
- ML - Introduction
- ML - Getting Started
- ML - Basic Concepts
- ML - Ecosystem
- ML - Python Libraries
- ML - Applications
- ML - Life Cycle
- ML - Required Skills
- ML - Implementation
- ML - Challenges & Common Issues
- ML - Limitations
- ML - Reallife Examples
- ML - Data Structure
- ML - Mathematics
- ML - Artificial Intelligence
- ML - Neural Networks
- ML - Deep Learning
- ML - Getting Datasets
- ML - Categorical Data
- ML - Data Loading
- ML - Data Understanding
- ML - Data Preparation
- ML - Models
- ML - Supervised Learning
- ML - Unsupervised Learning
- ML - Semi-supervised Learning
- ML - Reinforcement Learning
- ML - Supervised vs. Unsupervised
- Machine Learning Data Visualization
- ML - Data Visualization
- ML - Histograms
- ML - Density Plots
- ML - Box and Whisker Plots
- ML - Correlation Matrix Plots
- ML - Scatter Matrix Plots
- Statistics for Machine Learning
- ML - Statistics
- ML - Mean, Median, Mode
- ML - Standard Deviation
- ML - Percentiles
- ML - Data Distribution
- ML - Skewness and Kurtosis
- ML - Bias and Variance
- ML - Hypothesis
- Regression Analysis In ML
- ML - Regression Analysis
- ML - Linear Regression
- ML - Simple Linear Regression
- ML - Multiple Linear Regression
- ML - Polynomial Regression
- Classification Algorithms In ML
- ML - Classification Algorithms
- ML - Logistic Regression
- ML - K-Nearest Neighbors (KNN)
- ML - Naïve Bayes Algorithm
- ML - Decision Tree Algorithm
- ML - Support Vector Machine
- ML - Random Forest
- ML - Confusion Matrix
- ML - Stochastic Gradient Descent
- Clustering Algorithms In ML
- ML - Clustering Algorithms
- ML - Centroid-Based Clustering
- ML - K-Means Clustering
- ML - K-Medoids Clustering
- ML - Mean-Shift Clustering
- ML - Hierarchical Clustering
- ML - Density-Based Clustering
- ML - DBSCAN Clustering
- ML - OPTICS Clustering
- ML - HDBSCAN Clustering
- ML - BIRCH Clustering
- ML - Affinity Propagation
- ML - Distribution-Based Clustering
- ML - Agglomerative Clustering
- Dimensionality Reduction In ML
- ML - Dimensionality Reduction
- ML - Feature Selection
- ML - Feature Extraction
- ML - Backward Elimination
- ML - Forward Feature Construction
- ML - High Correlation Filter
- ML - Low Variance Filter
- ML - Missing Values Ratio
- ML - Principal Component Analysis
- Reinforcement Learning
- ML - Reinforcement Learning Algorithms
- ML - Exploitation & Exploration
- ML - Q-Learning
- ML - REINFORCE Algorithm
- ML - SARSA Reinforcement Learning
- ML - Actor-critic Method
- ML - Monte Carlo Methods
- ML - Temporal Difference
- Deep Reinforcement Learning
- ML - Deep Reinforcement Learning
- ML - Deep Reinforcement Learning Algorithms
- ML - Deep Q-Networks
- ML - Deep Deterministic Policy Gradient
- ML - Trust Region Methods
- Quantum Machine Learning
- ML - Quantum Machine Learning
- ML - Quantum Machine Learning with Python
- Machine Learning Miscellaneous
- ML - Performance Metrics
- ML - Automatic Workflows
- ML - Boost Model Performance
- ML - Gradient Boosting
- ML - Bootstrap Aggregation (Bagging)
- ML - Cross Validation
- ML - AUC-ROC Curve
- ML - Grid Search
- ML - Data Scaling
- ML - Train and Test
- ML - Association Rules
- ML - Apriori Algorithm
- ML - Gaussian Discriminant Analysis
- ML - Cost Function
- ML - Bayes Theorem
- ML - Precision and Recall
- ML - Adversarial
- ML - Stacking
- ML - Epoch
- ML - Perceptron
- ML - Regularization
- ML - Overfitting
- ML - P-value
- ML - Entropy
- ML - MLOps
- ML - Data Leakage
- ML - Monetizing Machine Learning
- ML - Types of Data
- Machine Learning - Resources
- ML - Quick Guide
- ML - Cheatsheet
- ML - Interview Questions
- ML - Useful Resources
- ML - Discussion
Machine Learning - K-Medoids Clustering
K-Medoids Clustering - Algorithm
The K-medoids clustering algorithm can be summarized as follows −
Initialize k medoids − Select k random data points from the dataset as the initial medoids.
Assign data points to medoids − Assign each data point to the nearest medoid.
Update medoids − For each cluster, select the data point that minimizes the sum of distances to all the other data points in the cluster, and set it as the new medoid.
Repeat steps 2 and 3 until convergence or a maximum number of iterations is reached.
Implementation in Python
To implement K-medoids clustering in Python, we can use the scikit-learn library. The scikit-learn library provides the KMedoids class, which can be used to perform K-medoids clustering on a dataset.
First, we need to import the required libraries −
from sklearn_extra.cluster import KMedoids
from sklearn.datasets import make_blobs
import matplotlib.pyplot as plt
Next, we generate a sample dataset using the make_blobs() function from scikit-learn −
X, y = make_blobs(n_samples=500, centers=3, random_state=42)
Here, we generate a dataset with 500 data points and 3 clusters.
Next, we initialize the KMedoids class and fit the data −
kmedoids = KMedoids(n_clusters=3, random_state=42)
kmedoids.fit(X)
Here, we set the number of clusters to 3 and use the random_state parameter to ensure reproducibility.
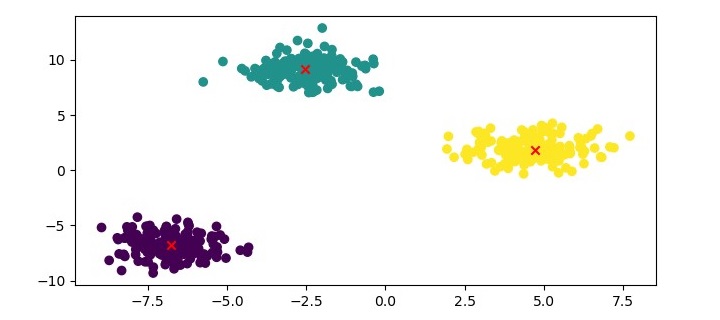
Finally, we can visualize the clustering results using a scatter plot −
plt.figure(figsize=(7.5, 3.5))
plt.scatter(X[:, 0], X[:, 1], c=kmedoids.labels_, cmap='viridis')
plt.scatter(kmedoids.cluster_centers_[:, 0],
kmedoids.cluster_centers_[:, 1], marker='x', color='red')
plt.show()
Example
Here is the complete implementation in Python −
from sklearn_extra.cluster import KMedoids
from sklearn.datasets import make_blobs
import matplotlib.pyplot as plt

# Generate sample data
X, y = make_blobs(n_samples=500, centers=3, random_state=42)

# Cluster the data using KMedoids
kmedoids = KMedoids(n_clusters=3, random_state=42)
kmedoids.fit(X)

# Plot the results
plt.figure(figsize=(7.5, 3.5))
plt.scatter(X[:, 0], X[:, 1], c=kmedoids.labels_, cmap='viridis')
plt.scatter(kmedoids.cluster_centers_[:, 0],
kmedoids.cluster_centers_[:, 1], marker='x', color='red')
plt.show()
Output
Here, we plot the data points as a scatter plot and color them based on their cluster labels. We also plot the medoids as red crosses.
K-Medoids Clustering - Advantages
Here are the advantages of using K-medoids clustering −
Robust to outliers and noise − K-medoids clustering is more robust to outliers and noise than K-means clustering because it uses a representative data point, called a medoid, to represent the center of the cluster.
Can handle non-Euclidean distance metrics − K-medoids clustering can be used with any distance metric, including non-Euclidean distance metrics, such as Manhattan distance and cosine similarity.
Computationally efficient − K-medoids clustering has a computational complexity of O(k*n^2), which is lower than the computational complexity of K-means clustering.
K-Medoids Clustering - Disadvantages
The disadvantages of using K-medoids clustering are as follows −
Sensitive to the choice of k − The performance of K-medoids clustering can be sensitive to the choice of k, the number of clusters.
Not suitable for high-dimensional data − K-medoids clustering may not perform well on high-dimensional data because the medoid selection process becomes computationally expensive.