- UML - Home
- UML - Overview
- UML - Challenges & Real-world Applications
- UML - Building Blocks
- UML - Architecture
- UML - Modeling Types
- UML - Basic Notations
- UML - Standard Diagrams
- UML - Class Diagram
- UML - Object Diagram
- UML - Component Diagram
- UML - Deployment Diagram
- UML - Use Case Diagram
- UML - Interaction Diagram
- UML - Statechart Diagram
- UML - Activity Diagram
- UML - Communication Diagram
- UML - Timing Diagram
- UML - Sequence Diagram
- UML - Collaboration Diagrams
- UML - Profile Diagram
- UML - Sequence Vs. Collaboration Diagrams
- UML - Sequence Vs. Collaboration Vs. Communication Diagrams
- UML - Association Vs. Aggregation Vs. Composition
- UML - Interaction Overview Diagram
- UML - Composite Structure Diagram
- UML - Object Constraint Language
- UML - Managing Models
- UML - Summary
- UML Useful Resources
- UML - UML Interview Questions & Answers
- UML - Useful Resources
- UML - Knowledge Test
UML - Statechart Diagrams
The name of the diagram itself clarifies the purpose of the diagram and other details. It describes different states of a component in a system. The states are specific to a component/object of a system.
A Statechart diagram describes a state machine. State machine can be defined as a machine which defines different states of an object and these states are controlled by external or internal events.
Activity diagram explained in the next chapter, is a special kind of a Statechart diagram. As Statechart diagram defines the states, it is used to model the lifetime of an object.
Purpose of Statechart Diagrams
Statechart diagram is one of the five UML diagrams used to model the dynamic nature of a system. They define different states of an object during its lifetime and these states are changed by events. Statechart diagrams are useful to model the reactive systems. Reactive systems can be defined as a system that responds to external or internal events.
Statechart diagram describes the flow of control from one state to another state. States are defined as a condition in which an object exists and it changes when some event is triggered. The most important purpose of Statechart diagram is to model lifetime of an object from creation to termination.
Statechart diagrams are also used for forward and reverse engineering of a system. However, the main purpose is to model the reactive system.
Following are the main purposes of using Statechart diagrams −
To model the dynamic aspect of a system.
To model the life time of a reactive system.
To describe different states of an object during its life time.
Define a state machine to model the states of an object.
How to Draw a Statechart Diagram?
Statechart diagram is used to describe the states of different objects in its life cycle. Emphasis is placed on the state changes upon some internal or external events. These states of objects are important to analyze and implement them accurately.
Statechart diagrams are very important for describing the states. States can be identified as the condition of objects when a particular event occurs.
Before drawing a Statechart diagram we should clarify the following points −
Identify the important objects to be analyzed.
Identify the states.
Identify the events.
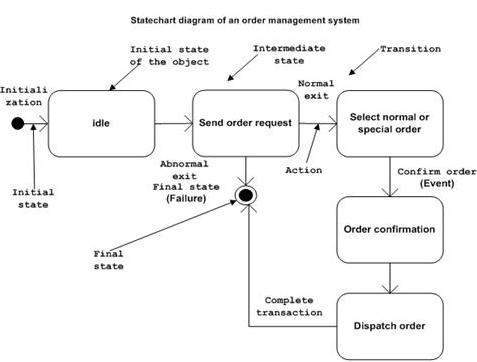
Following is an example of a Statechart diagram where the state of Order object is analyzed
The first state is an idle state from where the process starts. The next states are arrived for events like send request, confirm request, and dispatch order. These events are responsible for the state changes of order object.
During the life cycle of an object (here order object) it goes through the following states and there may be some abnormal exits. This abnormal exit may occur due to some problem in the system. When the entire life cycle is complete, it is considered as a complete transaction as shown in the following figure. The initial and final state of an object is also shown in the following figure.
Where to Use Statechart Diagrams?
From the above discussion, we can define the practical applications of a Statechart diagram. Statechart diagrams are used to model the dynamic aspect of a system like other four diagrams discussed in this tutorial. However, it has some distinguishing characteristics for modeling the dynamic nature.
Statechart diagram defines the states of a component and these state changes are dynamic in nature. Its specific purpose is to define the state changes triggered by events. Events are internal or external factors influencing the system.
Statechart diagrams are used to model the states and also the events operating on the system. When implementing a system, it is very important to clarify different states of an object during its life time and Statechart diagrams are used for this purpose. When these states and events are identified, they are used to model it and these models are used during the implementation of the system.
If we look into the practical implementation of Statechart diagram, then it is mainly used to analyze the object states influenced by events. This analysis is helpful to understand the system behavior during its execution.
The main usage can be described as −
To model the object states of a system.
To model the reactive system. Reactive system consists of reactive objects.
To identify the events responsible for state changes.
Forward and reverse engineering.