- Nagios - Home
- Nagios - Overview
- Nagios - Architecture
- Nagios - Products
- Nagios - Installation
- Nagios - Configuration
- Nagios - Features
- Nagios - Applications
- Nagios - Hosts and Services
- Nagios - Commands
- Nagios - Checks and States
- Nagios - Ports and Protocols
- Nagios - Add-ons/Plugins
- Nagios - NRPE
- Nagios - V Shell
- Nagios - Case Study
- Nagios Useful Resources
- Nagios - Quick Guide
- Nagios - Useful Resources
- Nagios - Discussion
Nagios - Quick Guide
Nagios - Overview
DevOps lifecycle is a continuous loop of several stages, continuous monitoring is the last stage of this loop. Continuous monitoring is one of the stages in this lifecycle. In this chapter, let us learn in detail about what continuous monitoring is and how Nagios is helpful for this purpose.
What is Continuous Monitoring
Continuous monitoring starts when the deployment is done on the production servers. From then on, this stage is responsible to monitor everything happening. This stage is very crucial for the business productivity.
There are several benefits of using Continuous monitoring −
- It detects all the server and network problems.
- It finds the root cause of the failure.
- It helps in reducing the maintenance cost.
- It helps in troubleshooting the performance issues.
- It helps in updating infrastructure before it gets outdated.
- It can fix problems automatically when detected.
- It makes sure the servers, services, applications, network is always up and running.
- It monitors complete infrastructure every second.
What is Nagios
Nagios is an open source continuous monitoring tool which monitors network, applications and servers. It can find and repair problems detected in the infrastructure, and stop future issues before they affect the end users. It gives the complete status of your IT infrastructure and its performance.
Why Nagios
Nagios offers the following features making it usable by a large group of user community −
- It can monitor Database servers such as SQL Server, Oracle, Mysql, Postgres
- It gives application level information (Apache, Postfix, LDAP, Citrix etc.).
- Provides active development.
- Has excellent support form huge active community.
- Nagios runs on any operating system.
- It can ping to see if host is reachable.
Benefits of Nagios
Nagios offers the following benefits for the users −
- It helps in getting rid of periodic testing.
- It detects split-second failures when the wrist strap is still in the intermittent stage.
- It reduces maintenance cost without sacrificing performance.
- It provides timely notification to the management of control and breakdown.
Nagios - Architecture
This chapter talks in detail about Nagios architecture.
Nagios Architecture
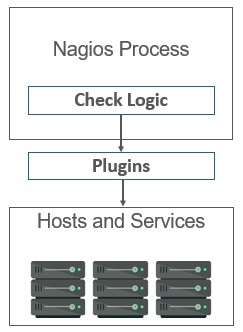
The following points are worth notable about Nagios architecture −
Nagios has server-agent architecture.
Nagios server is installed on the host and plugins are installed on the remote hosts/servers which are to be monitored.
Nagios sends a signal through a process scheduler to run the plugins on the local/remote hosts/servers.
Plugins collect the data (CPU usage, memory usage etc.) and sends it back to the scheduler.
Then the process schedules send the notifications to the admin/s and updates Nagios GUI.
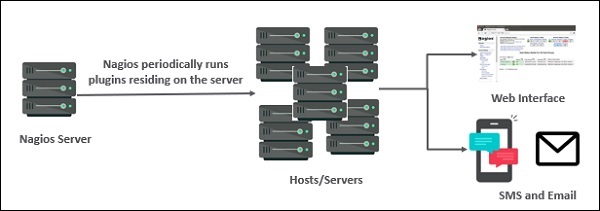
The following figure shows Nagios Server Agent Architecture in detail −
Nagios - Products
Nagios contains various products as discussed in detail below −
Nagios XI
It provides monitoring for complete IT infrastructure components like applications, services, network, operating systems etc. It gives a complete view of your infrastructure and business processes. The GUI is easily customizable giving the used flexibility. The standard edition of this tool costs $1995 and enterprise edition costs $3495.
Nagios Core
It is the core on monitoring IT infrastructure. Nagios XI product is also fundamentally based on Nagios core. Whenever there is any issue of failure in the infrastructure, it sends an alert/notification to the admin who can take the action quickly to resolve the issue. This tool is absolutely free.
Nagios Log Server
It makes searching of log data very simple and easy. It keeps all the log data at one location with high availability setup. It can easily send alerts if any issue is found in the log data. It can scale to 1000s of severs giving more power, speed, storage, and reliability to your log analysis platform. The price of this tool depends on the number of instances - 1 Instance $3995, 2 Instances $4995, 3 Instances $5995, 4 Instances $6995, 10 Instances $14995.
Nagios Fusion
This product provides a centralized view of complete monitoring system. With Nagios Fusion, you scan setup separate monitoring servers for separate geographies. It can be easily integrated with Nagios XI and Nagios core to give the complete visibility of the infrastructure. This tools costs $2495.
Nagios Network Analyser
It gives the complete information of the network infrastructure to the admin with the potential threats on the network so that admin can take quick actions. It shares very detailed data about the network after in-depth network analysis. This tools costs $1995.
Nagios - Installation
In this chapter, the steps to setup Nagios on Ubuntu are discussed in detail.
Before you install Nagios, some packages such as Apache, PHP, building packages etc., are required to be present on your Ubuntu system. Hence, let us install them first.
Step 1 − Run the following command to install pre-required packages −
sudo apt-get install wget build-essential apache2 php apache2-mod-php7.0 php-gd
libgd-dev sendmail unzip
Step 2 − Next, create user and group for Nagios and add them to Apache www-data user.
sudo useradd nagios
sudo groupadd nagcmd
sudo usermod -a -G nagcmd nagios
sudo usermod -a -G nagios,nagcmd www-data
Step 3 − Download the latest Nagios package.
wget https://assets.nagios.com/downloads/nagioscore/releases/nagios-
4.4.3.tar.gz
Step 4 − Extract the tarball file.
tar -xzf nagios-4.4.3.tar.gz
cd nagios-4.4.3/
Step 5 − Run the following command to compile Nagios from source.
./configure --with-nagios-group=nagios --with-command-group=nagcmd
Step 6 − Run the following command to build Nagios files.
make all
Step 7 − Run the command shown below to install all the Nagios files.
sudo make install
Step 8 − Run the following commands to install init and external command configuration files.
sudo make install-commandmode
sudo make install-init
sudo make install-config
sudo /usr/bin/install -c -m 644 sample-config/httpd.conf /etc/apache2/sitesavailable/
nagios.conf
Step 9 − Now copy the event handler directory to Nagios directory.
sudo cp -R contrib/eventhandlers/ /usr/local/nagios/libexec/
sudo chown -R nagios:nagios /usr/local/nagios/libexec/eventhandlers
Step 10 − Download and extract Nagios plugins.
cd
wget https://nagios-plugins.org/download/nagiosplugins-
2.2.1.tar.gz
tar -xzf nagios-plugins*.tar.gz
cd nagios-plugins-2.2.1/
Step 11 − Install Nagios plugins using the below command.
./configure --with-nagios-user=nagios --with-nagios-group=nagios --with-openssl
make
sudo make install
Step 12 − Now edit the Nagios configuration file and uncomment line number 51 → cfg_dir=/usr/local/nagios/etc/servers
sudo gedit /usr/local/nagios/etc/nagios.cfg
Step 13 − Now, create a server directory.
sudo mkdir -p /usr/local/nagios/etc/servers
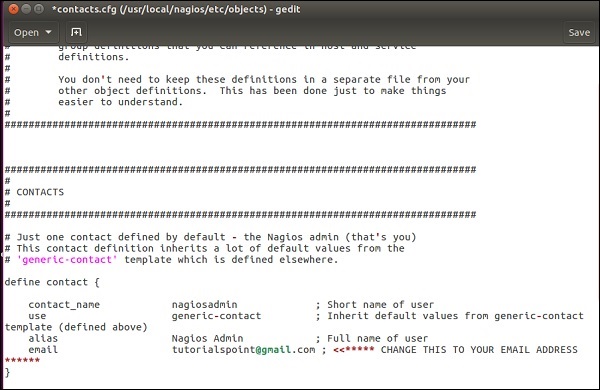
Step 14 − Edit contacts configuration file.
sudo gedit /usr/local/nagios/etc/objects/contacts.cfg
Step 15 − Now enable the Apache modules and configure a user nagiosadmin.
sudo a2enmod rewrite
sudo a2enmod cgi
sudo htpasswd -c /usr/local/nagios/etc/htpasswd.users nagiosadmin
sudo ln -s /etc/apache2/sites-available/nagios.conf /etc/apache2/sites-enabled/
Step 16 − Now, restart Apache and Nagios.
service apache2 restart
service nagios start
cd /etc/init.d/
sudo cp /etc/init.d/skeleton /etc/init.d/Nagios
Step 17 − Edit the Nagios file.
sudo gedit /etc/init.d/Nagios
DESC = "Nagios"
NAME = nagios
DAEMON = /usr/local/nagios/bin/$NAME
DAEMON_ARGS = "-d /usr/local/nagios/etc/nagios.cfg"
PIDFILE = /usr/local/nagios/var/$NAME.lock
Step 18 − Make the Nagios file executable and start Nagios.
sudo chmod +x /etc/init.d/nagios
service apache2 restart
service nagios start
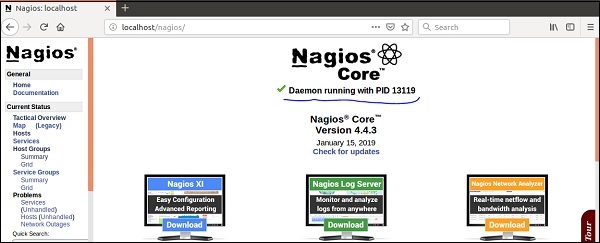
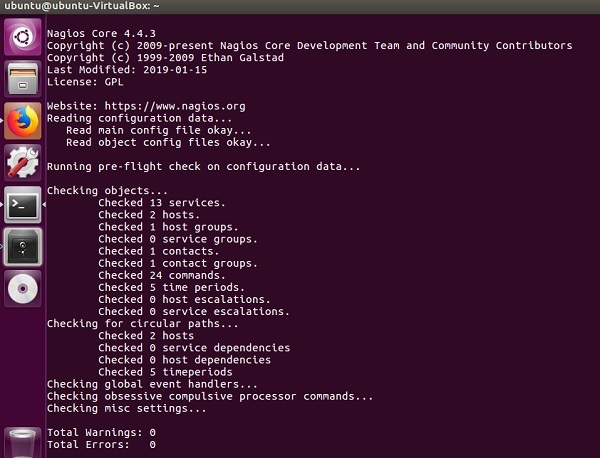
Step 19 − Now go to your browser and open url → http://localhost/nagios. Now login to Nagios with username nagiosadmin and use the password which you had set earlier. The login screen of Nagios is as shown in the screenshot given below −
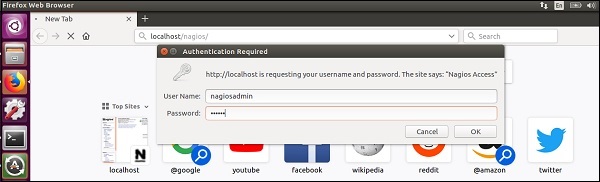
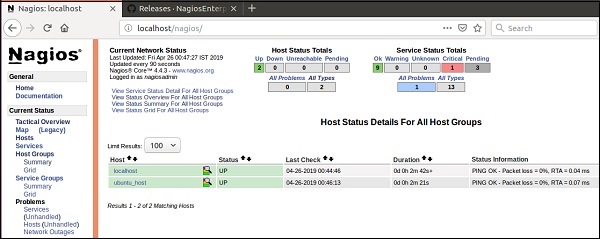
If you have followed all the steps correctly, you Nagios web interface will show up. You can find the Nagios dashboard as shown below −
Nagios - Configuration
In the previous chapter, we have seen the installation of Nagios. In this chapter, let us understand its configuration in detail.
The configuration files of Nagios are located in /usr/local/nagios/etc. These files are shown in the screenshot given below −
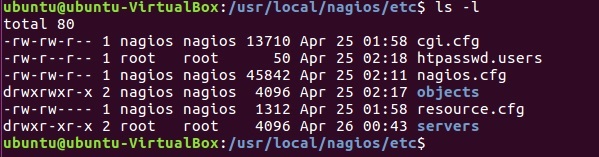
Let us understand the importance of each file now −
nagios.cfg
This is the main configuration file of Nagios core. This file contains the location of log file of Nagios, hosts and services state update interval, lock file and status.dat file. Nagios users and groups on which the instances are running are defined in this file. It has path of all the individual object config files like commands, contacts, templates etc.
cgi.cfg
By default, the CGI configuration file of Nagios is named cgi.cfg. It tells the CGIs where to find the main configuration file. The CGIs will read the main and host config files for any other data they might need. It contains all the user and group information and their rights and permissions. It also has the path for all frontend files of Nagios.
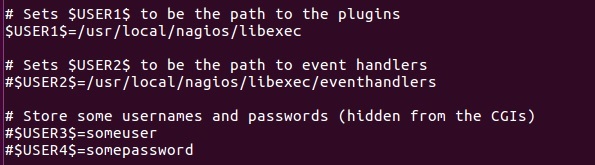
resource.cfg
You can define $USERx$ macros in this file, which can in turn be used in command definitions in your host config file(s). $USERx$ macros are useful for storing sensitive information such as usernames, passwords, etc.
They are also handy for specifying the path to plugins and event handlers - if you decide to move the plugins or event handlers to a different directory in the future, you can just update one or two $USERx$ macros, instead of modifying a lot of command definitions. Resource files may also be used to store configuration directives for external data sources like MySQL.
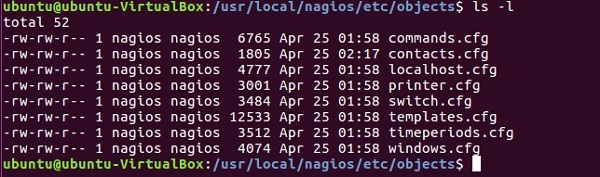
The configuration files inside objects directory have are used to define commands, contacts, hosts, services etc.
commands.cfg
This config file provides you with some example command definitions that you can refer in host, service, and contact definitions. These commands are used to check and monitor hosts and services. You can run these commands locally on a Linux console where you will also get the output of the command you run.
Example
define command {
   command_name check_local_disk
   command_line $USER1$/check_disk -w $ARG1$ -c $ARG2$ -p $ARG3$
}

define command {
   command_name check_local_load
   command_line $USER1$/check_load -w $ARG1$ -c $ARG2$
}

define command {
   command_name check_local_procs
   command_line $USER1$/check_procs -w $ARG1$ -c $ARG2$ -s $ARG3$
}
contacts.cfg
This file contains contacts and groups information of Nagios. By default, one contact is already present Nagios admin.
Example
define contact {
   contact_name nagiosadmin
   use generic-contact
   alias Nagios Admin
   email avi.dunken1991@gmail.com
}

define contactgroup {
   contactgroup_name admins
   alias Nagios Administrators
   members nagiosadmin
}
templates.cfg
This config file provides you with some example object definition templates that are referred by other host, service, contact, etc. definitions in other config files.
timeperiods.cfg
This config file provides you with some example timeperiod definitions that you can refer in host, service, contact, and dependency definitions.
Nagios - Features
Nagios is the monitoring tool with multitude of features as given below −
Nagios Core is open source, hence free to use.
Powerful monitoring engine which can scale and manage 1000s of hosts and servers.
Comprehensive web dashboard giving the visibility of complete network components and monitoring data.
It has multi-tenant capabilities where multiple users have access to Nagios dashboard.
It has extendable architecture which can easily integrate with third-party applications with multiple APIs.
Nagios has a very active and big community with over 1 million + users across the globe.
Fast alerting system, sends alerts to admins immediately after any issue is identified.
Multiple plugins available to support Nagios, custom coded plugins can also be used with Nagios.
It has good log and database system storing everything happening on the network with ease.
Proactive Planning feature helps to know when its time to upgrade the infrastructure.
Nagios - Applications
Nagios can be applicable to a wide range of applications. They are given here −
Monitor host resources such as disk space, system logs etc.
Monitor network resources http, ftp, smtp, ssh etc.
Monitor log files continuously to identify infra-issue.
Monitor windows/linux/unix/web applications and its state.
Nagios Remote Plugin Executer (NRPE) can monitor services remotely.
Run service checks in parallel.
SSH or SSL tunnels can also be used for remote monitoring.
Send alerts/notifications
via email, sms, pager of any issue on infrastructure
Recommending when to upgrade the IT infrastructure.
Nagios - Hosts and Services
Nagios is the most popular tool which is used to monitor hosts and services running in your IT infrastructure. Hosts and service configurations are the building blocks of Nagios Core.
Host is just like a computer; it can be a physical device or virtual.
Services are those which are used by Nagios to check something about a host.
You can create a host file inside the server directory of Nagios and mention the host and service definitions. For example −
sudo gedit /usr/local/nagios/etc/servers/ubuntu_host.cfg
# Ubuntu Host configuration file
define host {
   use linux-server
   host_name ubuntu_host
   alias Ubuntu Host
   address 192.168.1.10
   register 1
}
define service {
   host_name ubuntu_host
   service_description PING
   check_command check_ping!100.0,20%!500.0,60%
   max_check_attempts 2
   check_interval 2
   retry_interval 2
   check_period 24x7
   check_freshness 1
   contact_groups admins
   notification_interval 2
   notification_period 24x7
   notifications_enabled 1
   register 1
}
The above definitions add a host called ubuntu_host and defines the services which will run on this host. When you restart the Nagios, this host will start getting monitored by Nagios and the specified services will run.
There are many more services in Nagios which can be used to monitor pretty much anything on the running host.
Nagios - Commands
A command definition defines a command. Commands include service checks, service notifications, service event handlers, host checks, host notifications, and host event handlers. Command definitions for Nagios are defined in commands.cfg file.
The following is the format for defining of a Command −
define command {
   command_name command_name
   command_line command_line
}
Command name − This directive is used to identify the command. The definitions of contact, host, and service is referenced by command name.
Command line − This directive is used to define what is executed by Nagios when the command is used for service or host checks, notifications, or event handlers.
Example
define command{
   command_name check_ssh
   command_line /usr/lib/nagios/plugins/check_ssh $HOSTADDRESS$
}
This command will execute the plugin − /usr/libl/nagios/plugins/check_ssh with 1 parameter : '$HOSTADDRESS$'
A very short host definition that would use this check command could be similar to the one shown here −
define host{
   host_name host_tutorial
   address 10.0.0.1
   check_command check_ssh
}
The command definitions tell how to perform host/service checks. The also define how to generate notifications if any issue is identified and to handle any event. There are several commands to perform the checks, such as commands to check if SSH is working properly or not, command to check that database is up and running, command to check if a host is alive or not and many more.
There are commands which tell users what issues are present in the infrastructure. You can create your own custom commands or use any third-party command in Nagios, and they are treated similar to Nagios plugins project, there is no distinction between them.
You can also pass arguments in the command, this give more flexibility in performing the checks. This is how you need to define a command with parameter −
define command {
   command_name check-host-alive-limits
   command_line $USER5$/check_ping -H $HOSTADDRESS$ -w $ARG1$ -c $ARG2$ -p 5
}
The host definition for the above command −
define host {
   host_name system2
   address 10.0.15.1
   check_command check-host-alive-limits!1000.0,70%!5000.0,100%
}
You can run external commands in Nagios by adding them to commands file which is processed by Nagios daemon periodically.
With External commands you can achieve lot many checks while Nagios is running. You can temporarily disable few checks, or force some checks to run immediately, disable notifications temporarily etc. The following is the syntax of external commands in Nagios that must be written in command file −
[time] command_id;command_arguments
You can also check out the list of all external commands that can be used in Nagios here − https://assets.nagios.com/downloads/nagioscore/docs/externalcmds/
Nagios - Checks and States
Once the host and services are configured on Nagios, checks are used to see if the hosts and services are working as they are supposed to or not. Let us see an example to perform checks on host −
Consider that you have put your host definitions inside host1.cfg file in /usr/local/nagios/etc/objects directory.
cd /usr/local/nagios/etc/objects
gedit host1.cfg
This is how your host definitions look currently −
define host {
   host_name host1
   address 10.0.0.1
}
Now let us add check_interval directive. This directive is used to perform scheduled checks of the hosts for the number you set; by default it is in minutes. Using the definition below, checks on the host will be performed after every 3 minutes.
define host {
   host_name host1
   address 10.0.0.1
   check_interval 3
}
In Nagios, 2 types of checks are performed on hosts and services −
- Active Checks
- Passive Checks
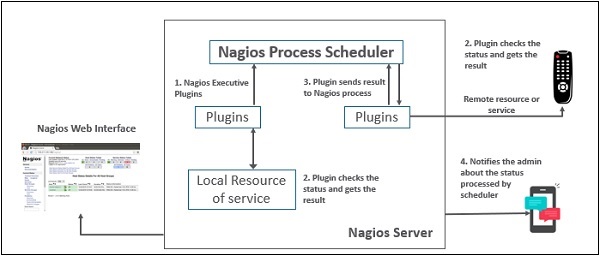
Active Checks
Active checks are initiated by Nagios process and then run on a regular scheduled basis. The check logic inside Nagios process starts the Active check. To monitor hosts and services running on remote machines, Nagios executes plugins and tells what information to collect. Plugin then gets executed on the remote machine where is collects the required information and sends then back to Nagios daemon. Depending on the status received on hosts and services, appropriate action is taken.
The figure shown below shows an active check −
These are executed on regular intervals, as defined by check_interval and retry_interval.
Passive checks are performed by external processes and the results are given back to Nagios for processing.
Passive checks work as explained here −
An external application checks the status on hosts/services and writes the result to External Command File. When Nagios daemon reads external command file, it reads and sends all the passive checks in the queue to process them later. Periodically when these checks are processed, notifications or alerts are sent depending on the information in check result.
The figure shown below shows a passive check −
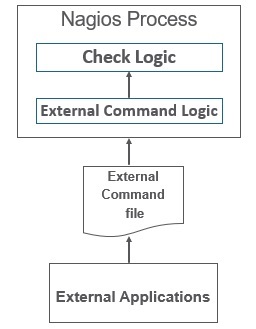
Thus, the difference between active and passive check is that active checks are run by Nagios and passive checks are run by external applications.
These checks are useful when you cannot monitor hosts/services on a regular basis.
Nagios stores the status of the hosts and services it is monitoring to determine if they are working properly or not. There would be many cases when the failures will happen randomly and they are temporary; hence Nagios uses states to check the current status of a host or service.
There are two types of states −
- Soft state
- Hard state
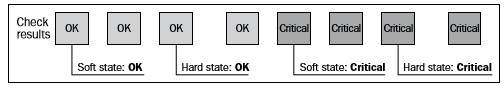
Soft state
When a host or service is down for a very short duration of time and its status is not known or different from previous one, then soft states are used. The host or the services will be tested again and again till the time the status is permanent.
Hard State
When max_check_attempts is executed and status of the host or service is still not OK, then hard state is used. Nagios executes event handlers to handle hard states.
The following figure shows soft states and hard states.
Nagios - Ports and Protocols
This chapter gives an idea of ports and protocols that Nagios comprises.
Protocols
The default protocols used by Nagios are as given under −
http(s), ports 80 and 443 − The product interfaces are web-based in Nagios. Nagios agents can use http to move data.
snmp, ports 161 and 162 − snmp is an important part of network monitoring. Port 161 is used to send requests to nodes and post 162 is used to receive results.
ssh, port 22 − Nagios is built to run natively on CentOS or RHEL Linux. Administrator can login into Nagios through SSH whenever they feel to do so and perform checks.
Ports
The Default ports used by common Nagios Plugins are as given under −
- Butcheck_nt (nsclient++) 12489
- NRPE 5666
- NSCA 5667
- NCPA 5693
- MSSQL 1433
- MySQL 3306
- PostgreSQL 5432
- MongoDB 27017, 27018
- OracleDB 1521
- Email (SMTP) 25, 465, 587
- WMI 135, 445 / additionaldynamically-assigned ports in 1024-1034 range
Nagios - Add-ons/Plugins
Plugins helps to monitor databases, operating systems, applications, network equipment, protocols with Nagios. Plugins are compiled executables or script (Perl or non-Perl) that extends Nagios functionality to monitor servers and hosts. Nagios will execute a Plugin to check the status of a service or host. Nagios can be compiled with support for an embedded Perl interpreter to execute Perl plugins. Without it, Nagios executes Perl and non-Perl plugins by forking and executing the plugins as an external command.
Types of Nagios Plugins
Nagios has the following plugins available in it −
Official Nagios Plugins − There are 50 official Nagios Plugins. Official Nagios plugins are developed and maintained by the official Nagios Plugins Team.
Community Plugins − There are over 3,000 third party Nagios plugins that have been developed by hundreds of Nagios community members.
Custom Plugins − You can also write your own Custom Plugins. There are certain guidelines that must be followed to write Custom Plugins.
Guidelines for Writing Custom Nagios Plugins
While writing custom plugin in Nagios, you need to follow the guidelines given below −
- Plugins should provide a "-V" command-line option (verify the configuration changes)
- Print only one line of text
- Print the diagnostic and only part of the help message
- Network plugins use DEFAULT_SOCKET_TIMEOUT to timeout
- "-v", or "--verbose is related to verbosity level
- "-t" or "--timeout" (plugin timeout);
- "-w" or "--warning" (warning threshold);
- "-c" or "--critical" (critical threshold);
- "-H" or "--hostname" (name of the host to check)
Multiple Nagios plugin run and perform checks at the same time, for all of them to run smoothly together, Nagios plugin follow a status code. The table given below tells the exit code status and its description −
| Exit Code | Status | Description |
|---|---|---|
| 0 | OK | Working fine |
| 1 | WARNING | Working fine, but needs attention |
| 2 | CRITICAL | Not working Correctly |
| 3 | UNKNOWN | When the plugin is unable to determine the status of the host/service |
Nagios plugins use options for their configuration. The following are few important parameters accepted by Nagios plugin −
| Sr.No | Option & Description |
|---|---|
| 1 | -h, --help This provides help |
| 2 | -V, --version This prints the exact version of the plugin |
| 3 | -v, --verbose This makes the plugin give a more detailed information on what it is doing |
| 4 | -t, --timeout This provides the timeout (in seconds); after this time, the plugin will report CRITICAL status |
| 5 | -w, --warning This provides the plugin-specific limits for the WARNING status |
| 6 | -c, --critical This provides the plugin-specific limits for the CRITICAL status |
| 7 | -H, --hostname This provides the hostname, IP address, or Unix socket to communicate with |
| 8 | -4, --use-ipv4 This lets you use IPv4 for network connectivity |
| 9 | -6, --use-ipv6 This lets you use IPv6 for network connectivity |
| 10 | -p, --port This is used to connect to the TCP or UDP port |
| 11 | -s, -- send This provides the string that will be sent to the server |
| 12 | -e, --expect This provides the string that should be sent back from the server |
| 13 | -q, --quit This provides the string to send to the server to close the connection |
Nagios plugin package has lot of checks available for hosts and services to monitor the infrastructure. Let us try out Nagios plugins to perform few checks.
SMTP is a protocol that is used for sending emails. Nagios standard plugins have commands for perform checks for SMTP. The command definition for SMTP −
define command {
   command_name check_smtp
   command_line $USER2$/check_smtp -H $HOSTADDRESS$
}
Let us use Nagios plugin to monitor MySQL. Nagios offers 2 plugins to monitor MySQL. The first plugin checks if mysql connection is working or not, and the second plugin is used to calculate the time taken to run a SQL query.
The commands definitions for both are as follows −
define command {
   command_name check_mysql
   command_line $USER1$/check_mysql H $HOSTADDRESS$ -u $ARG1$ -p $ARG2$ -d
   $ARG3$ -S w 10 c 30
}

define command {
   command_name check_mysql_query
   command_line $USER1$/check_mysql_query H $HOSTADDRESS$ -u $ARG1$ -p $ARG2$ -d
   $ARG3$ -q $ARG4$ w $ARG5$ -c $ARG6$
}
Note − Username, password, and database name are required as arguments in both the commands.
Nagios offers plugin to check the disk space mounted on all the partitions. The command definition is as follows
define command {
   command_name check_partition
   command_line $USER1$/check_disk p $ARG1$ w $ARG2$ -c $ARG3$
}
Majority of checks can be done through standard Nagios plugins. But there are applications which require special checks to monitor them, in which case you can use 3rd party Nagios plugins which will provide more sophisticated checks on the application. It is important to know about security and licensing issues when you are using a 3rd party plugin form Nagios exchange or downloading the plugin from another website.
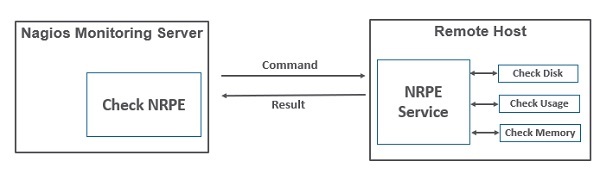
Nagios - NRPE
The Nagios daemon which run checks on remote machines in NRPE (Nagios Remote Plugin Executor). It allows you to run Nagios plugins on other machines remotely. You can monitor remote machine metrics such as disk usage, CPU load etc. It can also check metrics of remote windows machines through some windows agent addons.
Let us see how to install and configure NRPE step by step on client machine which needs to be monitored.
Step 1 − Run below command to install NRPE on the remote linux machine to be monitored.
sudo apt-get install nagios-nrpe-server nagios-plugins
Step 2 − Now, create a host file inside the server directory, and put all the necessary definitions for the host.
sudo gedit /usr/local/nagios/etc/servers/ubuntu_host.cfg
# Ubuntu Host configuration file

define host {
   use linux-server
   host_name ubuntu_host
   alias Ubuntu Host
   address 192.168.1.10
   register 1
}

define service {
   host_name ubuntu_host
   service_description PING
   check_command check_ping!100.0,20%!500.0,60%
   max_check_attempts 2
   check_interval 2
   retry_interval 2
   check_period 24x7
   check_freshness 1
   contact_groups admins
   notification_interval 2
   notification_period 24x7
   notifications_enabled 1
   register 1
}

define service {
   host_name ubuntu_host
   service_description Check Users
   check_command check_local_users!20!50
   max_check_attempts 2
   check_interval 2
   retry_interval 2
   check_period 24x7
   check_freshness 1
   contact_groups admins
   notification_interval 2
   notification_period 24x7
   notifications_enabled 1
   register 1
}

define service {
   host_name ubuntu_host
   service_description Local Disk
   check_command check_local_disk!20%!10%!/
   max_check_attempts 2
   check_interval 2
   retry_interval 2
   check_period 24x7
   check_freshness 1
   groups admins
   notification_interval 2
   notification_period 24x7
   notifications_enabled 1
   register 1
}

define service {
   host_name ubuntu_host
   service_description Check SSH
   check_command check_ssh
   max_check_attempts 2
   check_interval 2
   retry_interval 2
   check_period 24x7
   check_freshness 1
   contact_groups admins
   notification_interval 2
   notification_period 24x7
   notifications_enabled 1
   register 1
}

define service {
   host_name ubuntu_host
   service_description Total Process
   check_command check_local_procs!250!400!RSZDT
   max_check_attempts 2
   check_interval 2
   retry_interval 2
   check_period 24x7
   check_freshness 1
   contact_groups admins
   notification_interval 2
   notification_period 24x7
   notifications_enabled 1
   register 1
}
Step 3 − Run the command shown below for the verification of configuration file.
sudo /usr/local/nagios/bin/nagios -v /usr/local/nagios/etc/nagios.cfg
Step 4 − Restart NRPE, Apache and Nagios if there are no errors.
service nagios-nrpe-server restart
service apache2 restart
service nagios restart
Step 5 − Open your browser and go to Nagios web interface. You can see the host which needs to be monitored has been added to Nagios core service. Similarly, you can add more hosts to be monitored by Nagios.
Nagios - V Shell
V-Shell is a lightweight web interface to Nagios Core written in PHP. It is easy to install and use and it is an alternative to Nagios output. The frontend of VShell is on AngularJs, hence the design is responsive and modern. It provides Quicksearch functionality and RESTful API powered by CodeIgniter.
Nagios VShell is compatible with Nagios XI and Nagios Core 3.x. It requires php 5.3 or higher, php-cli and apache installed in the system. Let us see how to install Nagios VShell.
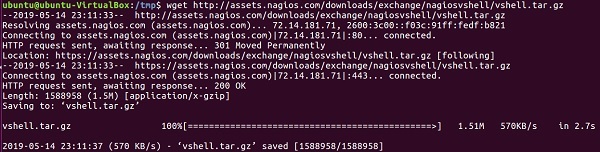
Step 1 − Go to tmp directory and download the vshell tar file.
cd /tmp
wget http://assets.nagios.com/downloads/exchange/nagiosvshell/vshell.tar.gz
Step 2 − Extract the tar file.
tar zxf vshell.tar.gz
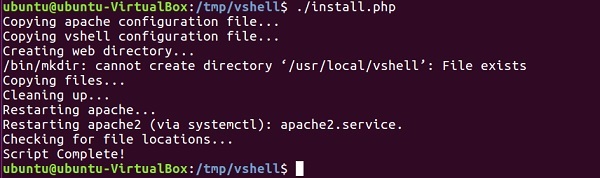
Step 3 − Go to vshell directory and give executable permission to install.php file. Finally, run the install script.
cd vshell
chmod +x install.php
./install.php
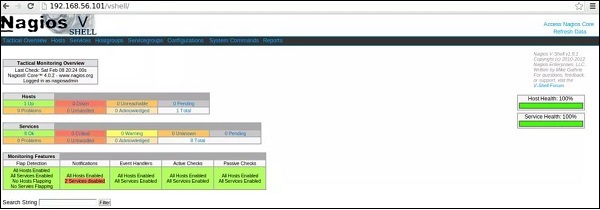
Step 4 − Now go tohttps://192.168.56.101/vshell in your browser, login with nagiosadmin and your Vshell will appear.
Nagios - Case Study
In this chapter, let us look into case studies of two organizations that have successfully implemented Nagios.
Bitnetix with Nagios
Bitnetix in an IT consulting organization which is into networking, datacenter, monitoring and Voice over IP. Through their offerings, they make small businesses look big. Their solutions help you in managing customer relationships in a better way by increasing more engagement and improving their satisfaction. They say they are in business of communication, hence communicating right message to their customers at the right time is very important for them.
Bitnetix was working with a customer who were into Email Marketing. They used to monitor AWS servers which were dynamically allocated and were responsible to deliver thousands of emails to customers. They were using Nagios core earlier but wanted to move to new Nagios XI and integrate with chef with zero downtime. There were challenges in moving live status configuration on Nagios core to appropriate checks in Nagios XI. But with Nagios, they were able to setup Nagios XI configuration file with chef integrated. They were able to move all the customers from Nagios core to Nagios XI with Zero downtime. Nagios XI was also able to integrate with PagerDuty for sending instant notifications.
EverWatch.gobal with Nagios
EverWatch.global is an IT management and consulting organization which helps non-profit and small/medium organizations. Its headquarter is based in Rochester, New York. They have won numerous awards for their work with Nagios.
EverWatch.global was working with an ecommerce retail client with a billion-dollar annual revenue. They were responsible to keeping the website up and running at all the time, monitoring cart and checkout functionality, send notifications to necessary staff in case of defamation. The challenge was their clients servers were located 500 miles from its headquarters in New York. For monitoring production, staging, quality assurance and development on the same platform, the configurations were supposed to be unique and similar for both areas.
With the help of Nagios, they were able to create ssh firewall rules for equipment and Network Operations Center. They were also able to perform checks for defamation occurrences and reduced false positives. By configuring event handlers in Nagios, the number of notifications drastically decreased. Nagios helped them by keeping their clients website uptime to 98% annually from 85% annually, this was a huge success.
In real dollar terms, the company was able to achieve almost $125,000,000 in additional sales as a result. Eric Loyd, CEOEverWatch Global.