- Mean, Median, and Mode
- Home
- Mode of a Data Set
- Finding the Mode and Range of a Data Set
- Finding the Mode and Range from a Line Plot
- Mean of a Data Set
- Understanding the Mean Graphically: Two bars
- Understanding the Mean Graphically: Four or more bars
- Finding the Mean of a Symmetric Distribution
- Computations Involving the Mean, Sample Size, and Sum of a Data Set
- Finding the Value for a New Score that will yield a Given Mean
- Mean and Median of a Data Set
- How Changing a Value Affects the Mean and Median
- Finding Outliers in a Data Set
- Choosing the Best Measure to Describe Data
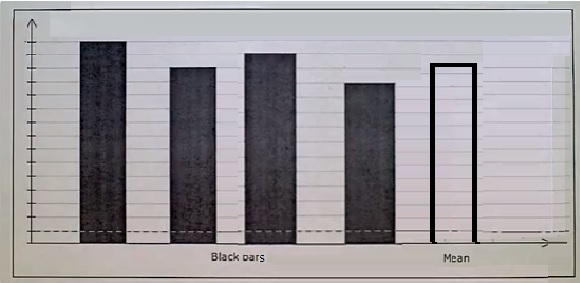
Understanding the Mean Graphically: Four or more bars
Introduction
In this lesson we understand the mean of a dataset using graphical method. Suppose we are given a bar graph showing four bars of data. Here we are required to find the mean of given data graphically.
Rules to find the mean graphically
In the bar graph we find the heights of the four bars.
The average or mean of these heights is found.
We then draw a fifth bar with the average height found in second step.
The height of this fifth bar gives the mean or average of given data set graphically.
Example 1
The four bars in a bar graph have heights 14, 16, 18, and 22. What height a new bar should have so that it is the mean height of the four bars?
Solution
Step 1:
Heights of given bars 14, 16, 18 and 22
Step 2:
Mean height = $\frac{(14 + 16 + 18 + 22)}{4} = \frac{70}{4}$ = 17.5
So height of new bar = 17.5.
Example 2
The four bars in a bar graph have heights 15, 16, 17 and 20. What height a new bar should have so that it is the mean height of the four bars?
Solution
Step 1:
Heights of given bars 15, 16, 17 and 20
Step 2:
Mean height = $\frac{(15 + 16 + 17 + 20)}{4} = \frac{68}{4}$ = 17
So height of new bar = 17