- Mean, Median, and Mode
- Home
- Mode of a Data Set
- Finding the Mode and Range of a Data Set
- Finding the Mode and Range from a Line Plot
- Mean of a Data Set
- Understanding the Mean Graphically: Two bars
- Understanding the Mean Graphically: Four or more bars
- Finding the Mean of a Symmetric Distribution
- Computations Involving the Mean, Sample Size, and Sum of a Data Set
- Finding the Value for a New Score that will yield a Given Mean
- Mean and Median of a Data Set
- How Changing a Value Affects the Mean and Median
- Finding Outliers in a Data Set
- Choosing the Best Measure to Describe Data
Finding the Mode and Range from a Line Plot
Introduction
A line plot of a data set shows the various numbers of the data set along the x axis as per a convenient scale. It also shows the number of occurrences of each of the numbers as crosses. The smallest and largest numbers among the data set also find a place on the line plot.
By examining the line plot, we find the number with the maximum number of crosses or occurrences. This gives the mode of the data set.
We find the smallest and the largest number from the data set and find their difference and this difference is the range of the given data set.
This is how the mode and range of a data set is found from its line plot.
Example 1
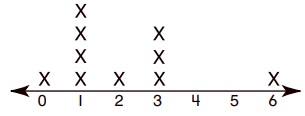
Find the mode and range from the following line plot
Solution
Step 1:
The number that repeats most is 1; Mode = 1
Step 2:
Range = Max number Min number
= 6 0 = 6
Step 3:
Mode = 1; Range = 6
Example 2
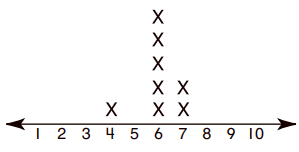
Find the mode and range from the following line plot −
Solution
Step 1:
The number that repeats most is 6; Mode = 6
Step 2:
Range = Max number Min number
= 7 4 = 3
Step 3:
Mode = 6; Range = 3